
Figure 10.
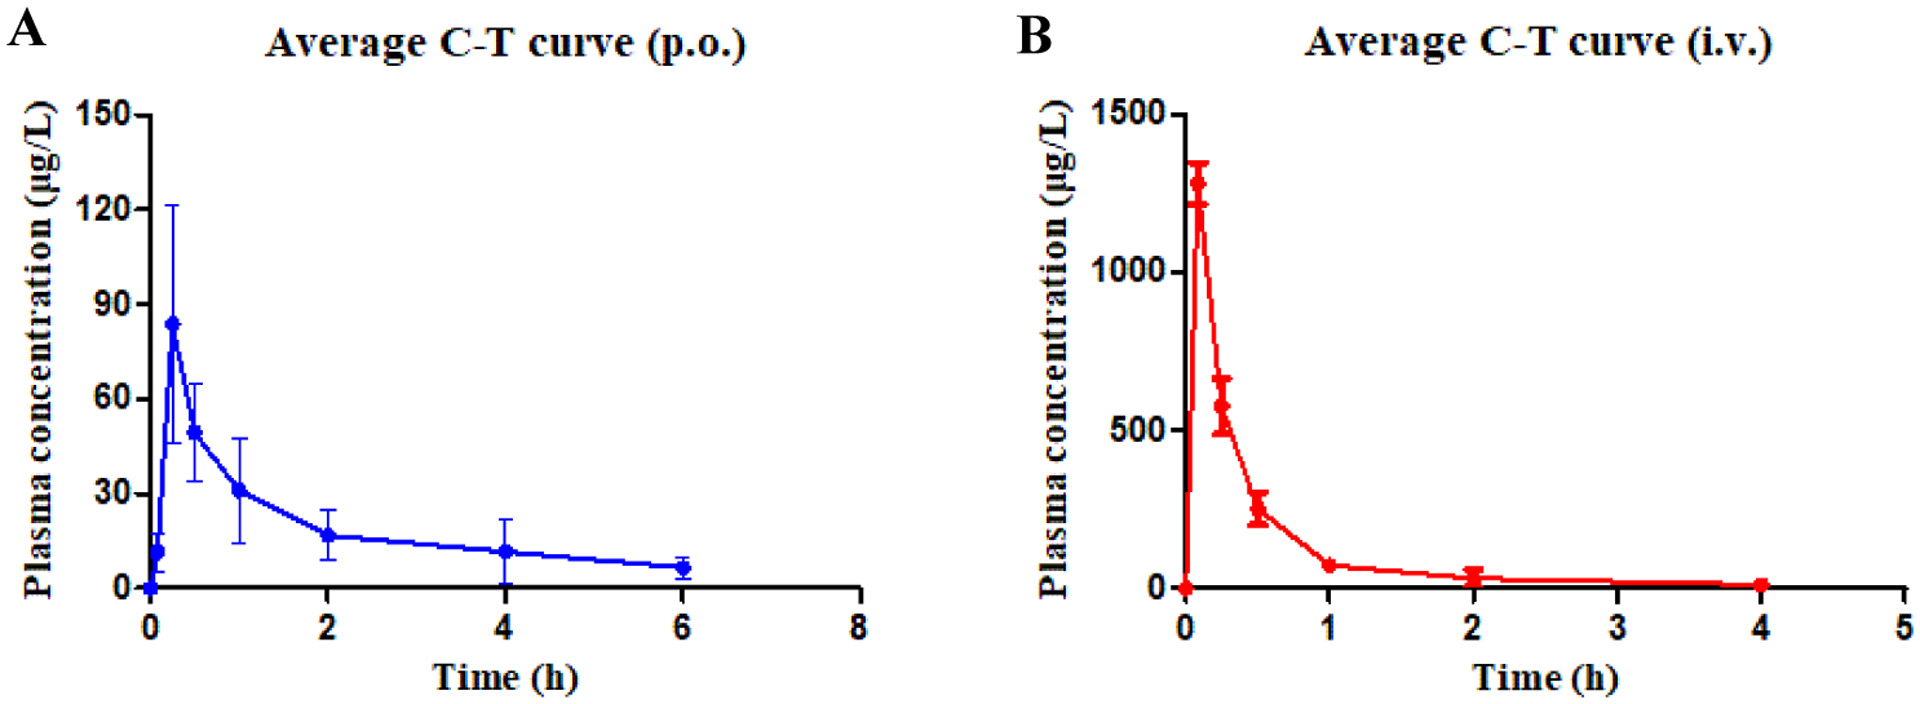
Plasma concentration–time profiles in rats following oral administration (11l, 20 mg/kg, A) and intravenous administration (11l, 2 mg/kg, B).
Official websites use .gov
A
.gov website belongs to an official
government organization in the United States.
Secure .gov websites use HTTPS
A lock (
) or https:// means you've safely
connected to the .gov website. Share sensitive
information only on official, secure websites.
Plasma concentration–time profiles in rats following oral administration (11l, 20 mg/kg, A) and intravenous administration (11l, 2 mg/kg, B).