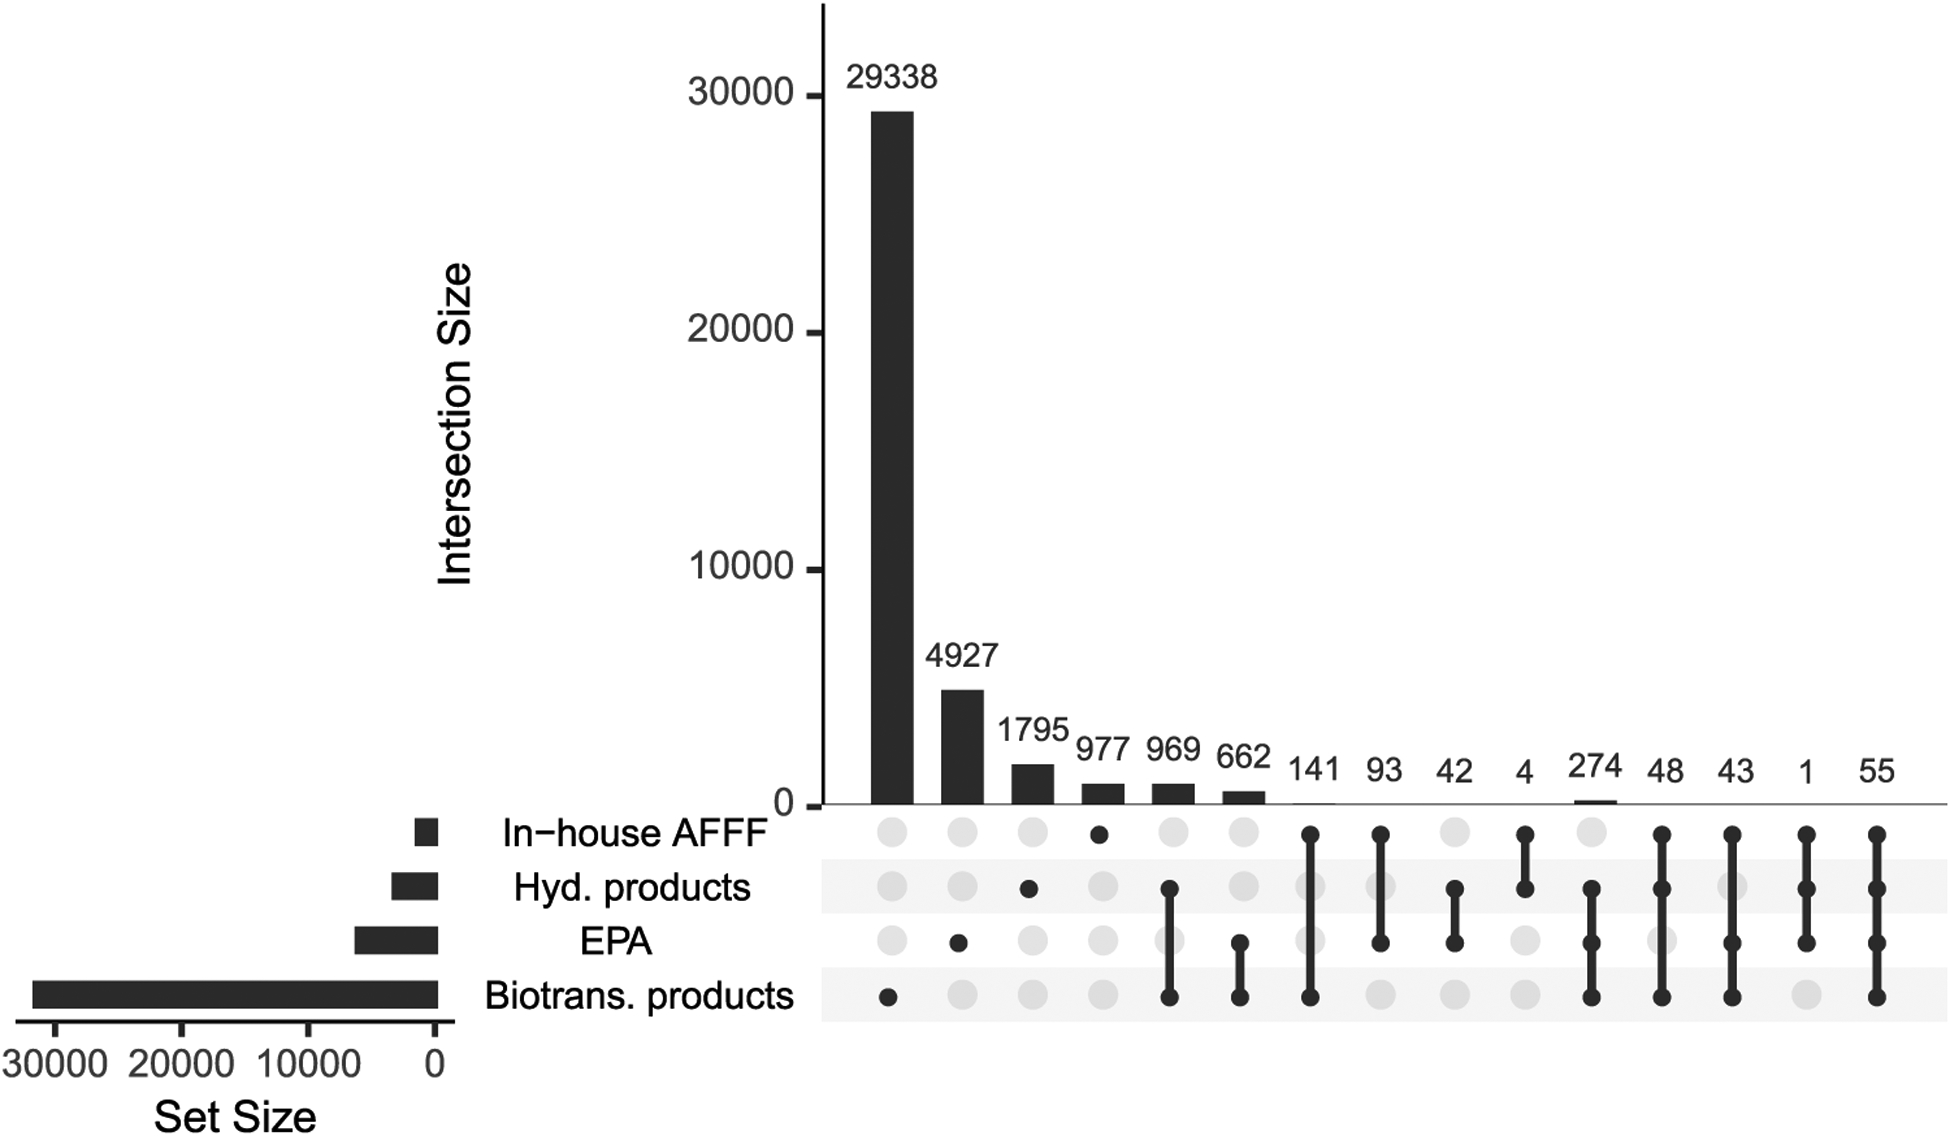
Figure 3.

Up-set diagram depicting the total number of unique structures (i.e., set size) and overlap between various input lists and predicted transformation products (i.e., intersection size). The total number of entries in each chemical structure list (i.e., set) is indicated by horizontal bars (i.e., set size) in the lower left. Vertical bars denote the intersection size between lists denoted with filled circles below the bar. For example, the biotransformation product structure list contained 29 338 structures not found in other lists, while 969 structures are shared between the EPA and biotransformation product datasets.
