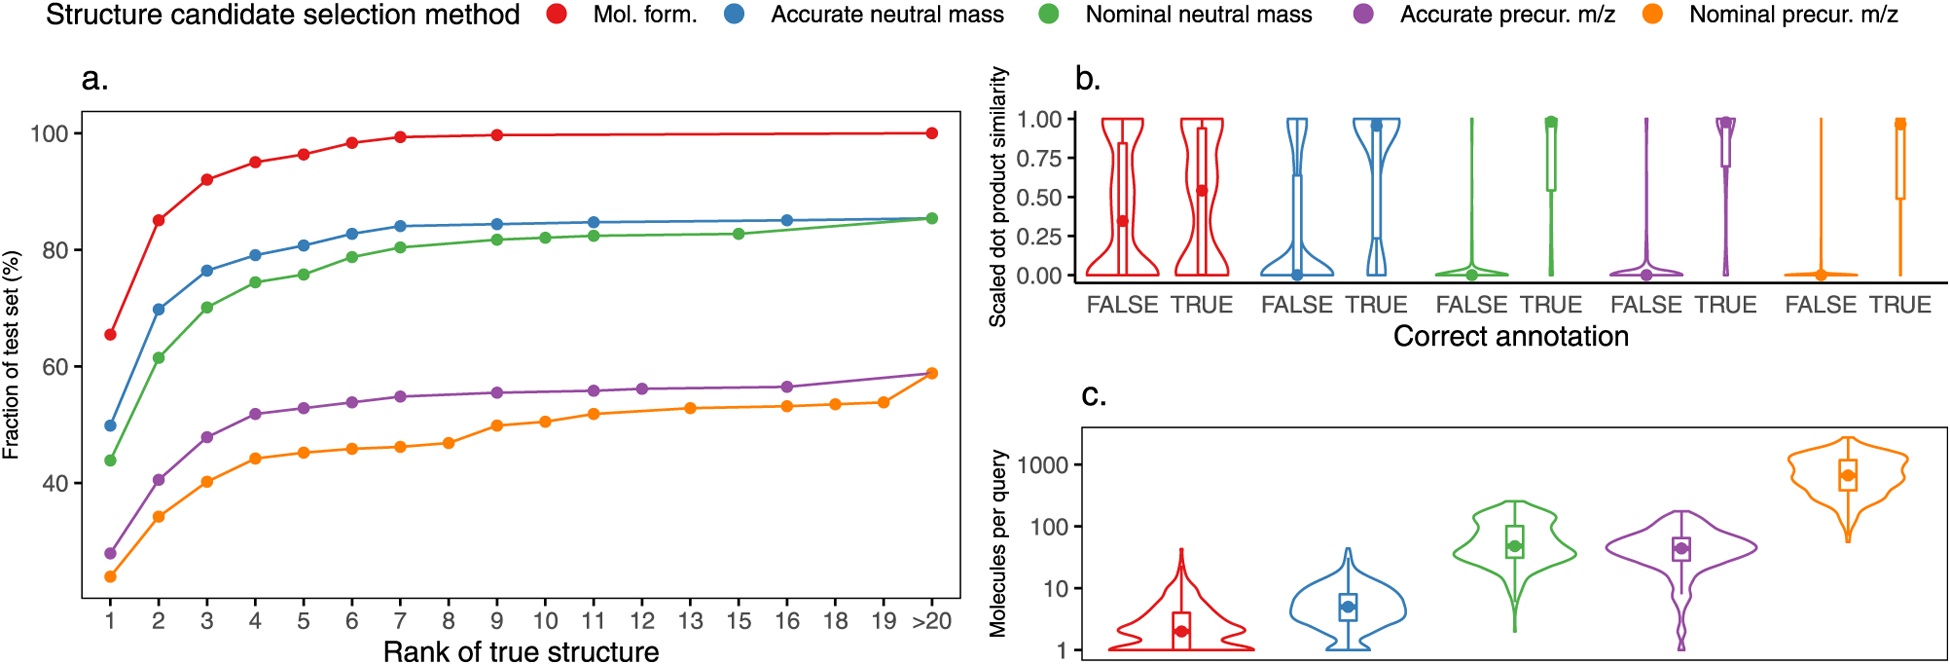
Figure 6.

Results of searching 301 experimental MS/MS spectra against the constructed in silico MS/MS library by various search strategies. For each search strategy, the experimental spectra were compared to the subset of database molecules corresponding to the search strategy (e.g., isomers, isobars). (a) Fraction of test set spectra by the rank of the true structure by various search strategies. (b) Scaled dot-product similarities for correct and incorrect structure annotations by different search strategies. (c) Number of unique structures per query by different search strategies. Violin plots in panels (b) and (c) show the estimated kernel density of the data distribution, while the inlaid box and whisker plots show the median value, interquartile range, and extreme values for each distribution.
