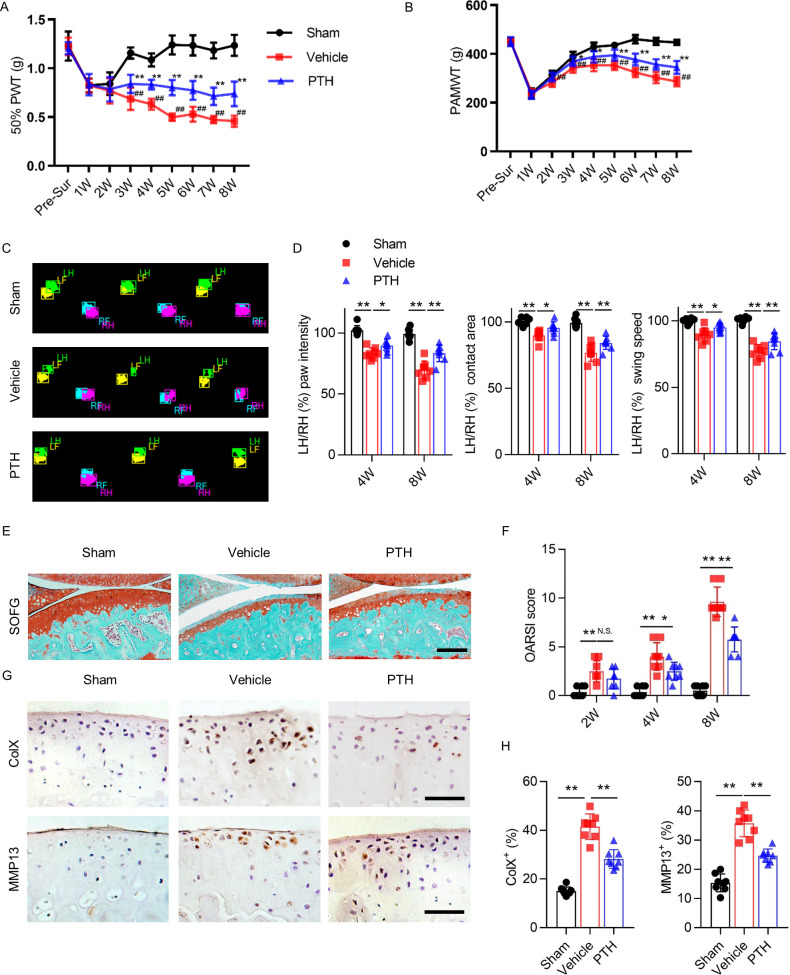
Figure 1. Parathyroid hormone (PTH) improves osteoarthritis pain and joint degeneration after DMM surgery.
(A) 50% paw withdrawal threshold (50% PWT) was tested in the left hind paw of sham-operated, PTH-treated, destabilized medial meniscus (DMM), and vehicle-treated DMM mice at different time points (n = 8/group). #, ##Vehicle-treated DMM mice compared with sham mice; *,**Vehicle-treated DMM mice compared with PTH-treated DMM mice. (B) Withdrawal threshold measured by pain application measurement (PAMWT) at the left knee of sham-operated, PTH-treated DMM, and vehicle-treated DMM mice (n = 8/group). #, ##Vehicle-treated DMM mice compared with sham mice; *,**Vehicle-treated DMM mice compared with PTH-treated DMM mice. (C) Representative images of gait analysis of sham-operated, PTH-treated DMM. and vehicle-treated DMM mice. RH = right hind paw (pink), LH = left hind paw (green), RF = right front paw (blue), LF = left front paw (yellow). (D) Quantitative analysis of LH intensity, LH area, and LH swing speed compared with the RH at week 8 after sham or DMM surgery (n = 8/group). (E) Safranin O/fast green (SOFG) staining of sagittal sections of the tibial medial compartment, proteoglycan (red) and bone (green) at week 8 after sham or DMM surgery. Age of mice used for sections: 18 weeks old. Scale bar: 250 μm. (F) Osteoarthritis Research Society International (OARSI) scores at weeks 2, 4, and 8 after surgery (n = 8/group). (G) Immunohistochemical analysis of matrix metalloproteinase 13+ (MMP13+, brown) and type X collagen+ (ColX+, brown) in articular cartilage at week 8 after sham or DMM surgery. Age of mice used for sections: 18 weeks old. Scale bar: 50 μm. (H) Quantitative analysis of MMP13+ and ColX+ cells in articular cartilage. All data are shown as means ± standard deviations (n = 8/group). *,#p<0.05, **,##p<0.01. NS, no significant difference.

