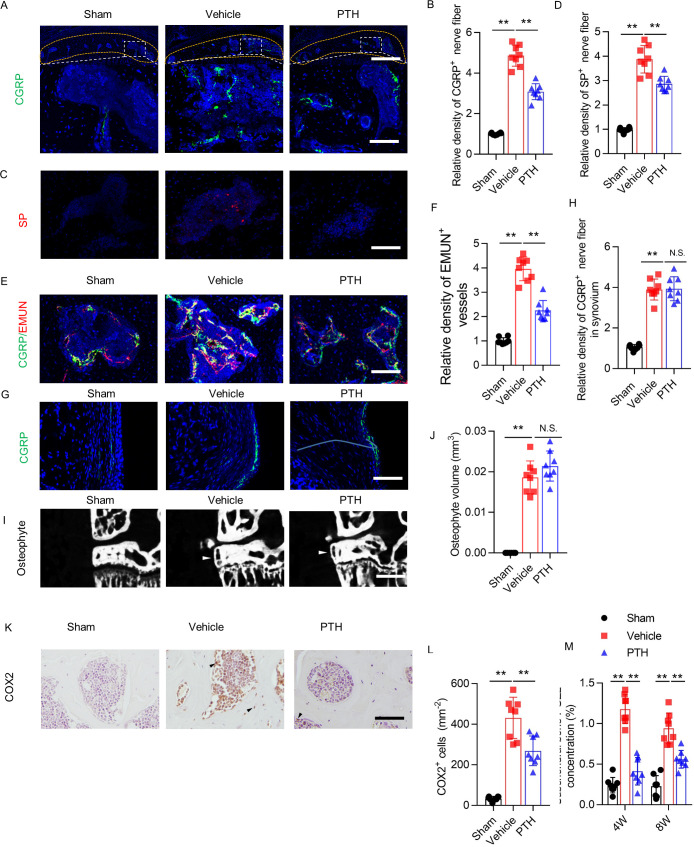
Figure 2. Sensory nerve innervation in subchondral bone decreased with PTH treatment.
(A) Immunofluorescence analysis of calcitonin gene-related peptide+ (CGRP+) (green) sensory nerve fibers in subchondral bone of sham-operated, PTH-treated DMM, and vehicle-treated DMM mice at week 8 after surgery. DAPI stains nuclei blue. Upper: low-magnification images (orange dotted line outlines the contour of the tibial subchondral bone), scale bar: 300 μm; bottom: high-magnification images. Scale bar: 50 μm. (B) Quantitative analysis of the density of CGRP+ sensory nerve fibers in tibial subchondral bone at week 8 after sham or DMM surgery (n = 8/group). (C, D) Immunofluorescence and quantitative analysis of substance P+ (SP+) (red) nerve fibers in subchondral bone at week 8 after sham or DMM surgery (n = 8/group). DAPI stains nuclei blue. Scale bar: 50 μm. (E, F) Representative images of immunofluorescence co-staining and quantitative analysis of the CGRP+ sensory nerves (green) and endomucin+ (EMUN) vessel (red) in the subchondral bone at week 8 after sham or DMM surgery (n = 8/group). Scale bar: 50 μm. (G, H) Immunofluorescence and quantitative analysis of CGRP+ (green) nerve fibers in synovium at week 8 after sham or DMM surgery. DAPI stains nuclei blue. Scale bar: 50 μm. n = 8/group. (I) μCT images of the tibial subchondral bone medial compartment (coronal) at week 8 after sham or DMM surgery. Arrowhead indicates the osteophyte. Scale bar: 500 μm. (J) Total volume measurement of osteophytes from the tibial plateau of sham-operated, PTH-treated DMM, and vehicle-treated DMM mice. (n = 8/group). (K) Immunohistochemical analysis of cyclooxygenase 2+ (COX2+) cells in the tibial subchondral bone at week 4 after DMM surgery. Arrowhead indicates the positive cells. Scale bar: 50 μm. (L) Quantitative analysis of COX2+ cells in mouse tibial subchondral bone (both bone marrow and subchondral bone matrix) (n = 8/group). (M) Quantitative analysis of PGE2 in subchondral bone determined by enzyme-linked immunosorbent assay (ELISA) (n = 8/group). *p<0.05, **p<0.01. NS, no significant difference.


