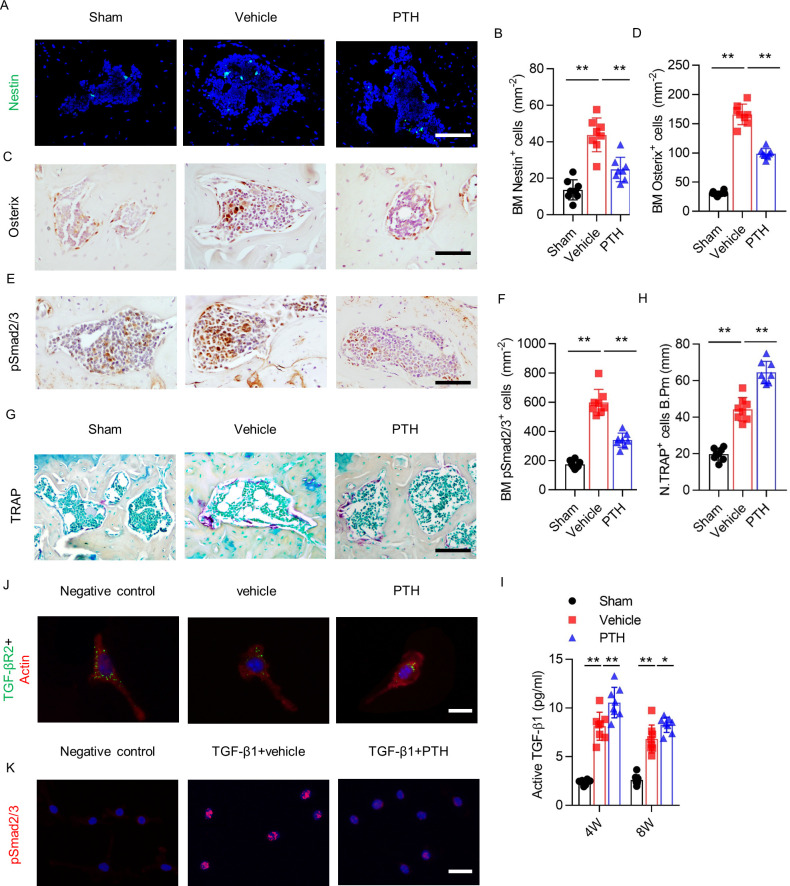
Figure 4. PTH sustains subchondral bone remodeling by endocytosis of TβRII.
(A, B) Immunofluorescence analysis and quantification of Nestin+ cells (green) in tibial subchondral bone at week 4 after sham or DMM surgery. Scale bar: 50 μm (n = 8/group). (C, D) Immunohistochemical analysis and quantification Osterix+ cells (brown) in tibial subchondral bone in different groups at week 4 after sham or DMM surgery. Scale bar: 50 μm (n = 8/group). (E, F) Immunohistochemical analysis and quantification of pSmad2/3+ cells (brown) in tibial subchondral bone at week 4 after sham or DMM surgery. Scale bar: 50 μm (n = 8/group). (G, H) Tartrate-resistant acid phosphatase (TRAP) staining (pink) and quantitative analysis of TRAP+ cells in tibial subchondral bone at week 4 after sham or DMM surgery. Scale bar: 100 μm (n = 8/group). (I) Quantitative analysis of active TGF-β in serum of mice at week 4 after sham or DMM surgery, determined by ELISA (n = 8/group). (J) Immunofluorescent analysis of TβRII (green) distribution on mouse bone marrow MSCs. Actin (red); DAPI stains nuclei blue. Scale bar: 10 μm. (K) Immunofluorescent analysis of pSmad2/3+ on mouse bone marrow MSCs. Scale bar: 25 μm. DAPI stains nuclei blue. *p<0.05, **p<0.01.

