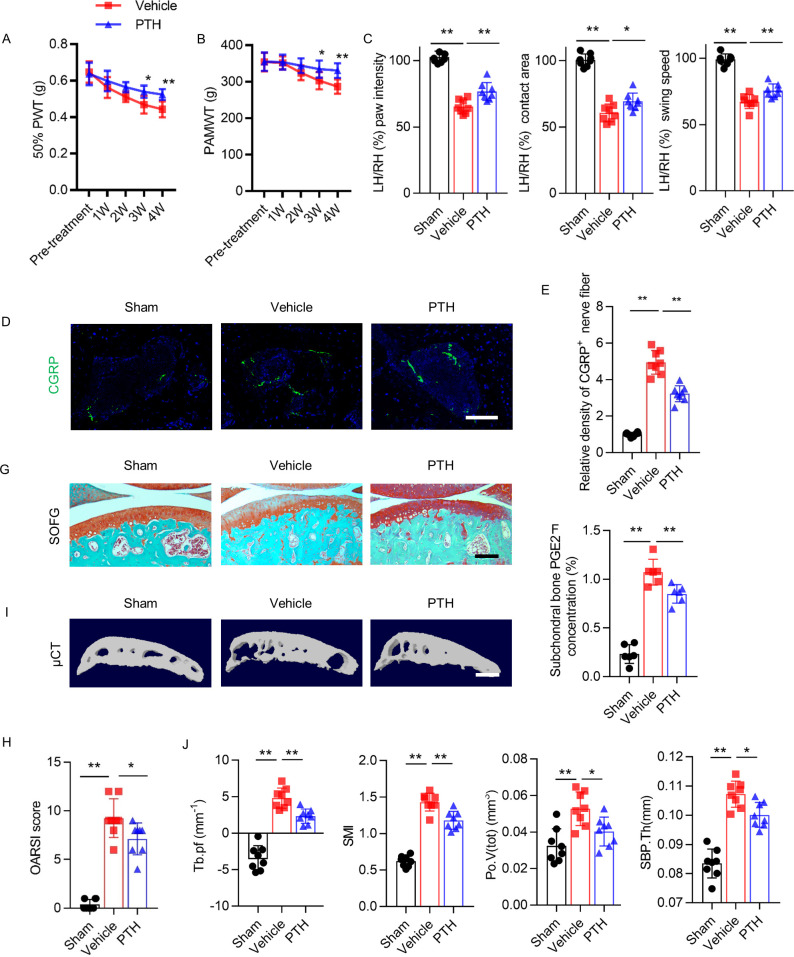
Figure 5. Delayed PTH attenuates progressive osteoarthritis pain and joint degeneration in DMM model mice.
(A, B) 50% PWT at the left hind paw (LH) and PAMWT at the left knee in PTH-treated DMM and vehicle-treated DMM mice, starting from week 4 to week 8 after DMM surgery (n = 8/group). *, **Vehicle-treated DMM mice compared with PTH-treated DMM mice. (C) Quantitative analysis of LH intensity, LH area, and LH swing speed compared with RH, based on catwalk analysis (n = 8/group). (D) Immunofluorescent analysis of the density of CGRP+ (green) sensory nerve fibers in tibial subchondral bone of sham-operated, PTH-treated DMM, and vehicle-treated mice at week 8 after sham or DMM surgery. DAPI stains nuclei blue. Scale bar: 50 μm. (E) Quantitative analysis of the density of CGRP+ sensory nerve fibers in tibial subchondral bone after DMM surgery (n = 8/group). (F) Quantitative analysis of PGE2 in subchondral bone determined by ELISA (n = 8/group). (G) SOFG staining of sagittal sections of the tibia medial compartment, proteoglycan (red) and bone (green) at week 8 after sham or DMM surgery. Scale bar: 250 μm (n = 8/group). (H) OARSI scores (n = 8/group). (I) 3-D, high-resolution μCT images of the tibial subchondral bone medial compartment (sagittal view) at week 8 after sham or DMM surgery. Scale bar: 500 μm. (J) Quantitative analysis of structural parameters of subchondral bone by μCT analysis: Tb.pf, SMI, Po.V(tot), and SBP.Th (n = 8/group). *p<0.05, **p<0.01.

