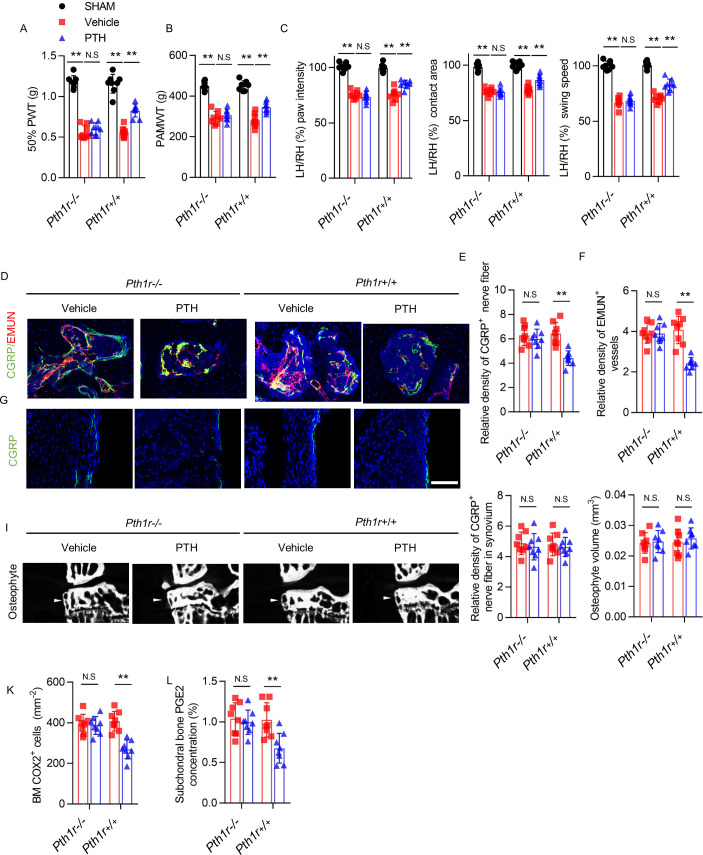
Figure 6. PTH-induced osteoarthritis pain relief is inhibited by PTH type one receptor knockout on Nestin+ MSCs.
(A, B) 50% PWT at the LH and PAMWT at the left knee in sham-operated, PTH-treated DMM, and vehicle-treated DMM PTH type one receptor−/− (Pth1r−/−) and Pth1r+/+ mice at week 8 after sham or DMM surgery (n = 8/group). (C) Quantitative analysis of LH intensity, LH area, and LH swing speed compared with the RH in sham-operated, PTH-treated DMM, and vehicle-treated DMM Pth1r−/− and Pth1r+/+ mice at week 8 after sham or DMM surgery, based on catwalk analysis (n = 8/group). (D–F) Immunofluorescent and quantitative analysis of CGRP+ (green) sensory nerve fibers and EMUN+ vessels (red) in tibial subchondral bone of PTH-treated or vehicle-treated Pth1r−/− and Pth1r+/+ mice at week 8 after DMM surgery (n = 8/group). Scale bar: 50 μm. (G, H) Immunofluorescent and quantitative analysis of CGRP+ (green) sensory nerve fibers in synovium of PTH-treated or vehicle-treated Pth1r−/− and Pth1r+/+ mice at week 8 after DMM surgery (n = 8/group). Scale bar: 50 μm. (I) μCT images of the tibial subchondral bone medial compartment (coronal) at week 8 after DMM surgery. Arrowhead indicates the osteophyte. Scale bar: 500 μm. (J) Total volume measurement of osteophytes from the tibial plateau of sham-operated, PTH-treated DMM, and vehicle-treated DMM Pth1r−/− and Pth1r+/+ mice (n = 8/group). (K) Immunohistochemical quantification of COX2+ cells in the tibial subchondral bone of mice at week 4 after DMM surgery (n = 8/group). (L) Quantitative analysis of PGE2 in subchondral bone determined by enzyme-linked immunosorbent assay (ELISA) (n = 8/group). *p<0.05, **p<0.01. NS, no significant difference.


