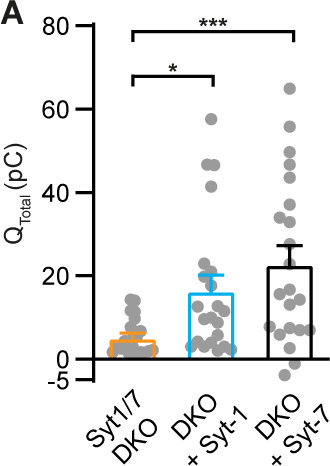
Figure 1. Syt-1 and Syt-7 are stand-alone calcium-sensors with different kinetics.
(A) Calcium uncaging experiment in Syt-1/Syt-7 DKO cells (orange) and in DKO cells overexpressing Syt-7 (black) or Syt-1 (blue). Top panel: [Ca2+] before (insert) and after calcium uncaging (uncaging flash at red arrow, bottom panel). Middle panel: capacitance traces (mean of all cells) show that the secretion is potentiated more (higher amplitude) by Syt-7 expression, but the kinetics of the secretory burst is faster after Syt-1 expression. Bottom panel: Mean amperometry (left ordinate axis) and mean integrated amperometry (right ordinate axis). Note that the integrated amperometric traces agree very well with the capacitance traces. (B) Sizes of the RRP and SRP. (C) Time constants, τ, of fusion for fast (i.e. RRP) and slow (i.e. SRP) secretion. (D) Sustained rates of secretion. Data information: In (A–D), data with error bars are presented as mean ± SEM; in (A), the traces are the mean of all cells. *: p<0.05; **: p<0.01; ***: p<0.001; ****: p<0.0001. Kruskal-Wallis test with Dunn’s post-hoc test. Number of cells, DKO: N = 23 cells; DKO + Syt-1: N = 22 cells; DKO + Syt-7: N = 21 cells. (E) Amperometric currents induced by infusion of ~5 μM Ca2+ into the cell via a patch pipette. Syt-1/Syt-7 DKO cells, DKO cells expressing either Syt-1 (blue trace) or Syt-7 (black trace). (F) Single amperometric spike, indicating measurement of peak current (Imax), total charge (Q, by integration), duration at half maximum (t1/2), and total duration of spike. The foot signal, which reports on the fusion pore before it expands, is indicated. (G) The spike interval. (H) Spike duration. (I) Duration at half maximum (t1/2). (J) Peak current (Imax). (K) Total charge of foot and spike (Q). (L) Spike 50–90% rise time. (M) Spike 75–25% decay time. (N) Duration of foot signal. (O) Amplitude of foot signal. (P) Charge of foot signal. The spike interval was significantly decreased by expression of either Syt-1 or Syt-7 in DKO cells. The shape parameters show that spikes have faster dynamics in the presence of Syt-1 than with Syt-7. Data information: In (G–P), data are presented as mean ± SEM. *: p<0.05; **: p<0.01; ***p<0.001. In (G, L, N): One-way ANOVA with post-hoc Tukey’s test. In (H, I, M): Kruskal-Wallis test with post-hoc Dunn's test. The spike interval (G) and the duration of foot signal (N) were log-transformed before statistical testing. Number of cells: DKO: N = 18 cells DKO + Syt-1: N = 21 cells; DKO + Syt-7: N = 24 cells.
Figure 1—figure supplement 1. Amperometric charge quantification.


