. 2021 Mar 22;10:e64527. doi: 10.7554/eLife.64527

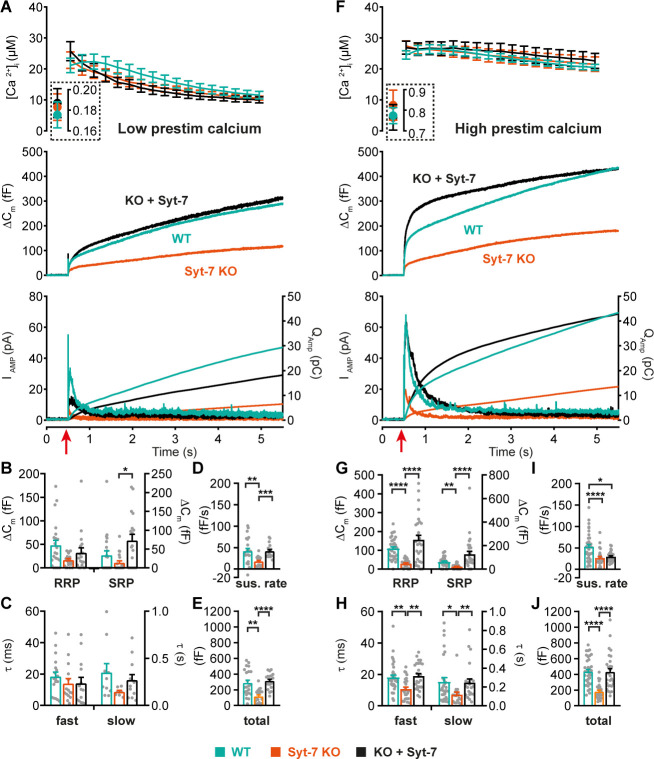
Figure 2. Syt-7 potentiates primed vesicle pool sizes at higher prestimulation [Ca2+].

(A) Calcium uncaging experiment from low prestimulation [Ca2+] in WT cells (persian green), Syt-7 KO cells (vermilion) and in Syt-7 KO cells overexpressing Syt-7 (black traces). Panels are arranged as in Figure 1A. (B) Sizes of the RRP and SRP. (C) Time constants of fusion for fast (i.e. RRP) and slow (i.e. SRP) secretion. (D) Sustained rates of secretion. (E) Total capacitance increase. (F) Calcium uncaging experiment from high prestimulation [Ca2+] in WT cells (green), Syt-7 KO cells (vermilion) and in Syt-7 KO cells overexpressing Syt-7 (black traces). Panels arranged as in Figure 1A. (G) Sizes of the RRP and SRP. (H) Time constants of fusion for fast (i.e. RRP) and slow (i.e. SRP) secretion. (I) Sustained rates of secretion. (J) Total capacitance increase. When stimulated from high prestimulation [Ca2+], Syt-7 expression potentiated RRP and SRP size. Data information: In (A–J) data with error bars are presented as mean ± SEM; in (A and F), the traces are the mean of all cells. *p<0.05; **p<0.01; ***p<0.001; ****p<0.0001. Kruskal-Wallis test with Dunn’s post-hoc test. Number of cells in (A–E): Syt-7 WT: N = 22 cells; Syt-7 KO: N = 19 cells; Syt-7 KO + Syt-7: N = 18 cells, in (F–J) Syt-7 WT: N = 36 cells; Syt-7 KO: N = 27 cells; Syt-7 KO + Syt-7: N = 28 cells. Note that in cases where a cell did not have a given pool (SRP or RRP), the size of that pool was set to zero, and no time constant was estimated.

Figure 2.

Figure 2—figure supplement 1. Amperometric charge quantification.
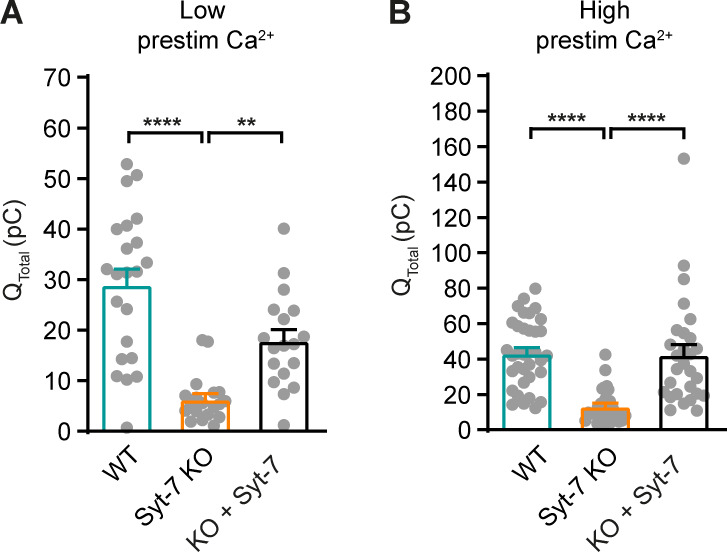
Figure 2—figure supplement 1.

(A) Integrated amperometry (mean ± SEM) of WT, Syt-7 KO, and Syt-7 KO overexpressing Syt-7 (KO + Syt-7) stimulated from low prestimulation [Ca2+]. **: p<0.01; ****: p<0.0001. Kruskal-Wallis test with post-hoc Dunn’s test. (B) Integrated amperometry (mean ± SEM) of WT, Syt-7 KO, and KO + Syt-7 stimulated from high prestimulation [Ca2+]. ****: p<0.0001. Kruskal-Wallis test with post-hoc Dunn’s test.
Figure 2—figure supplement 2. Mutation of Ca2+-binding sites in Syt-7 abolishes rescue function.

Figure 2—figure supplement 2.

(A) Single confocal slices of new-born mouse chromaffin cells stained against Syt-1 (α-Syt-1, mouse monoclonal α-Syt1 Synaptic Systems 105011), Syt-7 (α-Syt-7, rabbit polyconal α-Syt7, Synaptic Systems 105173) and GFP (α-GFP, chicken polyclonal Abcam ab13970) in WT cells, Syt-7 KO cells and Syt-7 KO cells overexpressing Syt-7 WT, a Syt-7 C2A-mutation (C2A*)(D225,227,233A), a Syt-7 C2B-mutation (C2B*) (D357,D359A), and a Syt-7 mutated in both C2A and C2B (C2AB*) (D225,227,233,357,359A). (B) Quantification (mean ± SEM) of staining against Syt-1, Syt-7 and GFP normalized to Syt-7 WT cells. ***: p<0.001; ****: p<0.0001. In B, middle panel: one-way ANOVA with post-hoc Dunnett’s test; B, left and right panels: Kruskal-Wallis test with post-hoc Dunn’s test. Number of cells: Syt-7 WT: N = 20 cells; Syt-7 KO overexpressing Syt-7: N = 21; C2A* mutation: N = 20 cells; C2B* mutation: N = 20 cells; C2AB* mutation: N = 20 cells. (C) Calcium uncaging experiment from a relatively high prestimulation [Ca2+] in Syt-7 KO cells (vermilion), in Syt-7 KO cells overexpressing Syt-7 WT (black traces), a Syt-7 C2A-mutation (C2A*, pink traces, D225,227,233A), a Syt-7 C2B-mutation (C2B*, green traces D357,D359A), and a Syt-7 mutated in both C2A and C2B (C2AB*, blue traces, D225,227,233,357,359A). Panels are arranged as in Figure 1A. (D) Sizes (mean ± SEM) of the RRP. (E) Sizes (mean ± SEM) of the SRP. (F) Sustained rate (mean ± SEM) of secretion. *: p<0.05; **: p<0.01; ***: p<0.001; ****: p<0.0001. Kruskal-Wallis with post-hoc Dunn's Multiple Comparison test. Syt-7 KO: N = 50 cells; Syt-7 KO + Syt-7 WT: N = 52 cells, Syt-7 KO + Syt-7 C2A*: N = 30 cells, Syt-7 KO + Syt-7 C2B*: N = 22 cells, Syt-7 KO + Syt-7 C2AB*: 20 cells.