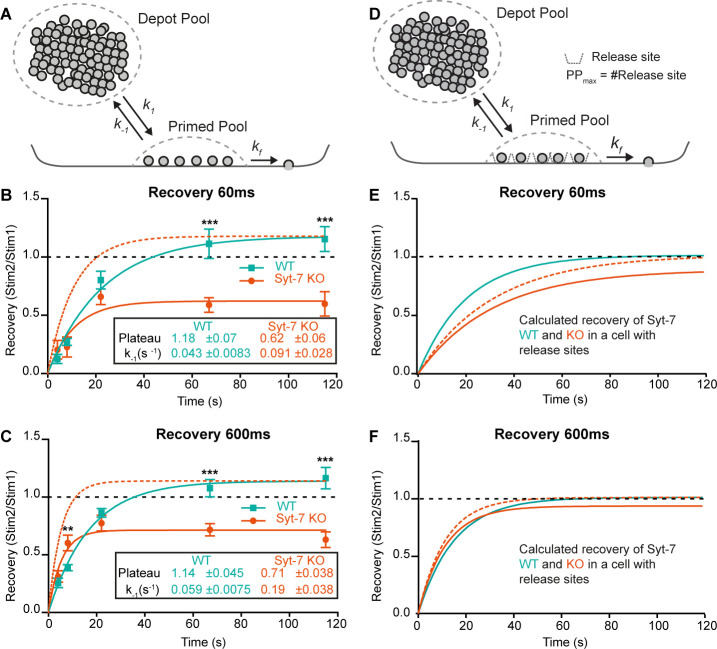
Figure 4. Syt-7 increases forward priming and decreases depriming.
(A) Simple model (Model I) featuring a single primed vesicle pool, a reversible priming reaction (forward rate: k1; reverse rate: k-1), and a fusion rate kf. (B) Recovery in WT cells (persian green) and Syt-7 KO cells (vermilion) of secretion at 60 ms after an uncaging stimulus, approximately corresponding to the RRP. Stim1, Stim2 = amplitude of secretion after first, or second, stimulus. Shown are mean ± SEM, plus a fit of a mono-exponential recovery curve (lines). The fit to the Syt-7 KO is also shown after scaling to the same amplitude as the WT curve (vermilion broken line), to show the faster kinetics. The fitted parameters: Plateau and the rate constant of recovery, which is the rate constant for depriming, k-1, under simplified assumptions (see text). Both Plateau and k-1 are significantly different from each other (Extra sum-of-squares F test for comparison of models, p<0.0001). (C) Same as B, but secretion at 600 ms after uncaging was used, approximately corresponding to the fusion of both RRP and SRP. (D) Model (Model II) featuring a single primed vesicle pool, limited by a fixed number of release sites, PPmax, a reversible priming reaction (forward rate: k1; reverse rate: k-1), and a fusion rate kf. (E) Recovery (at 60 ms) in the WT (green, Model II) with parameters recalculated from the fit of Model I to the data (panel B, see Materials and methods), and Syt-7 KO curve (vermilion), with the same change in priming and depriming rate as observed experimentally, now translated to a release site model, and after scaling to the WT amplitude (vermilion broken line). Under these circumstances, recovery in the Syt-7 KO trails the WT. (F) Recovery (at 600 ms) in the WT (Model II) with parameters recalculated from panel C, and in the KO (vermilion), when introducing the same changes as observed experimentally, translated to a release site model, and after scaling to the WT amplitude (vermilion broken lines). Under these circumstances, the Syt-7 KO leads the WT trace, but the differences are small. Data information: Data are presented as mean ± SEM. **: p<0.01; ***: p<0.001. In (B, C) Student’s t-test: test between genotypes (WT vs. KO) at the same inter stimulus intervals; Mann Whitney test: (600 ms: WT22s vs. KO22s).


