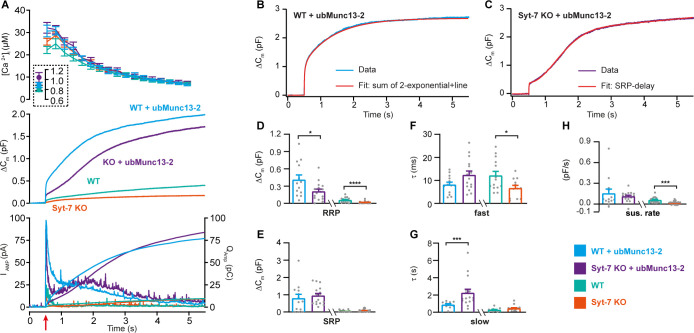
Figure 7. Syt-7 stimulates ubMunc13-2-dependent priming at low prestimulation [Ca2+].
(A) Calcium uncaging experiment in WT overexpressing ubMunc13-2 (WT + ubMunc13-2) (cyan traces), and Syt-7 KO overexpressing ubMunc13-2 (KO + ubMunc13-2) (purple traces) stimulated from a low prestimulation [Ca2+]. Data from Syt-7 WT and Syt-7 KO are the same as in Figure 2A. Panels are arranged as in Figure 1A. The overexpression of ubMunc13-2 potentiated the release in Syt-7 KO cells after a remarkable delay of the SRP. (B) An example capacitance trace (‘Data’) from a WT cell overexpressing ubMunc13-2 (cyan trace) with a function taking into account the SRP-delay (‘Fit’, red trace). (C) An example capacitance trace (‘Data’) from a Syt-7 KO cell overexpressing ubMunc13-2 (‘Fit’, purple trace) fitted with a function taking into account the SRP-delay (red trace). (D–H) In the Syt-7 WT + ubMunc13-2 or Syt-7 KO + ubMunc13-2, for each cell recorded, the chi-square values between fit and data were used to judge whether the standard sum of two exponentials and a line function or the function including the SRP delay (see Materials and methods) fitted the traces better. Values from the best fit were averaged to obtain the RRP, SRP sizes and time constants. (D, G) Sizes of the RRP and SRP. (E, H) Time constant, τ, of fusion for fast (i.e. RRP) and slow (i.e. SRP) secretion. Note that the τ for the SRP in the Syt-7 WT + ubMunc13-2 and Syt-7 KO + ubMunc13-2 groups include both the secretory delay and the fusion kinetics (Equation 7). Due to the slower τ for the SRP in this data set, we assumed that a τ originated from the RRP if τ ≤60 ms and from the SRP when 60 ms ≤τ ≤1600 ms (se Materials and methods). (F) Sustained rate of secretion. Note that in some cases when fitting with the function taking into account the SRP-delay, a negative sustained rate resulted from the fit. Data information: In (A–F) data with error bars are presented as mean ± SEM; in (A), the traces are the mean of all cells. WT (persian green) and Syt-7 KO (vermilion) were not obtained in parallel experiments, but are displayed here only to illustrate the increase upon ubMunc13-2 overexpression; statistical tests are only conducted for Syt-7 KO + ubMunc13-2 vs Syt-7 WT + ubMunc13-2 and Syt-7 WT vs Syt-7 KO. Note that the RRP size of WT vs Syt-7 KO is significantly differient, due to the two-group comparison, which was not the case in Figure 2A (three-group comparison). Statistics: *: p<0.05; **: p<0.01, Mann Whitney test. Number of cells: WT + ubMunc13-2: N = 17; Syt-7 KO + ubMunc13-2: N = 17 cells; WT: N = 22; Syt-7 KO: N = 19.


