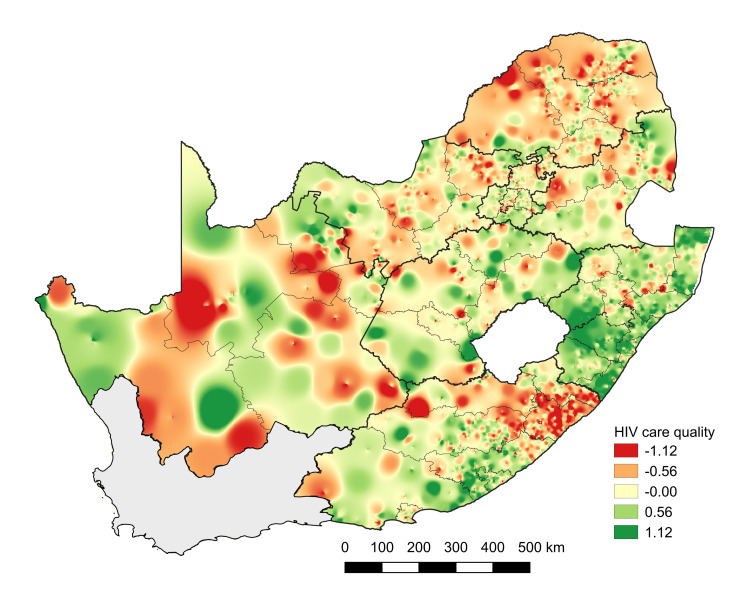
Fig 4. Geographic variation in quality of care, 2011–2015.
Figure displays geographic variability in facility-based quality of care scores estimated for the period 2011–2015. Base map was obtained from the South African Municipal Demarcations Board (http://www.demarcation.org.za/).

