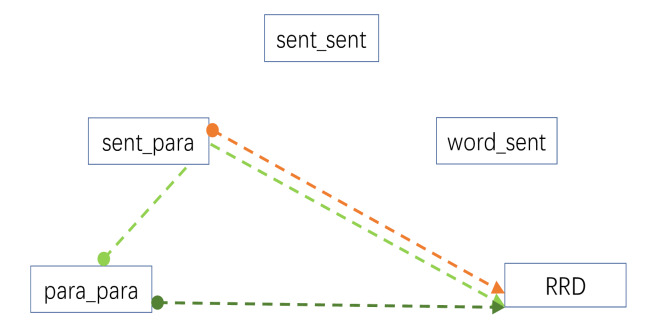
Figure 11.
Results of a path analysis showing the significant patterns of influence (p < 0.05) of the four similarity measures used in the analysis of RRD for good readers. Distinct paths are illustrated with different colours, where the start of the path is represented by a filled circle and its end by an arrowhead. Dashed paths indicate a negative estimate and a reduction in viewing time, solid lines are positive estimates that contribute to an increase in viewing time.

