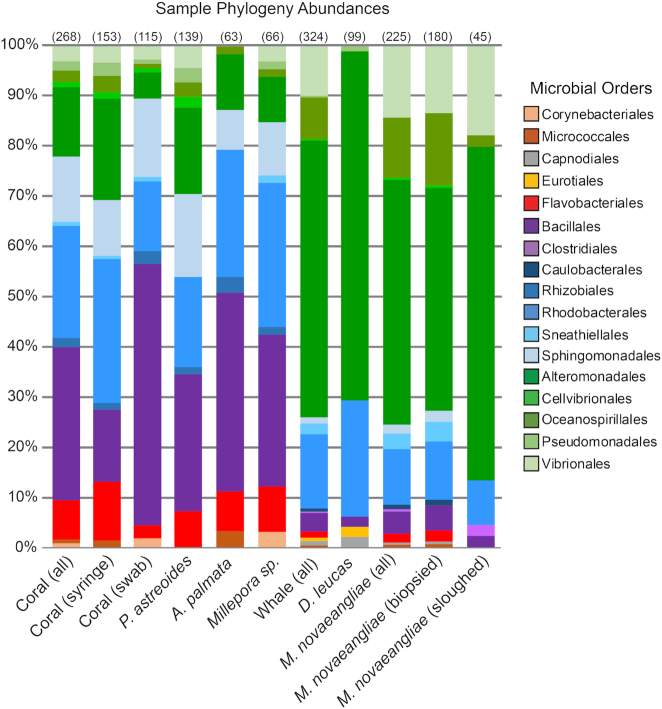
Figure 2.
Percent abundance of microbial orders for each sample type. Abundances of operational taxonomic units at the level of microbial order are shown. Orders of the same class are clustered by color. Only OTUs with abundance values above 0.1% are shown. The number in parentheses above each column indicates the number of SSU rRNA sequences used in the analysis for each sample type. The number in parentheses next to each sample type is the number of samples. See Table S1 (Supporting Information) for more sample information.

