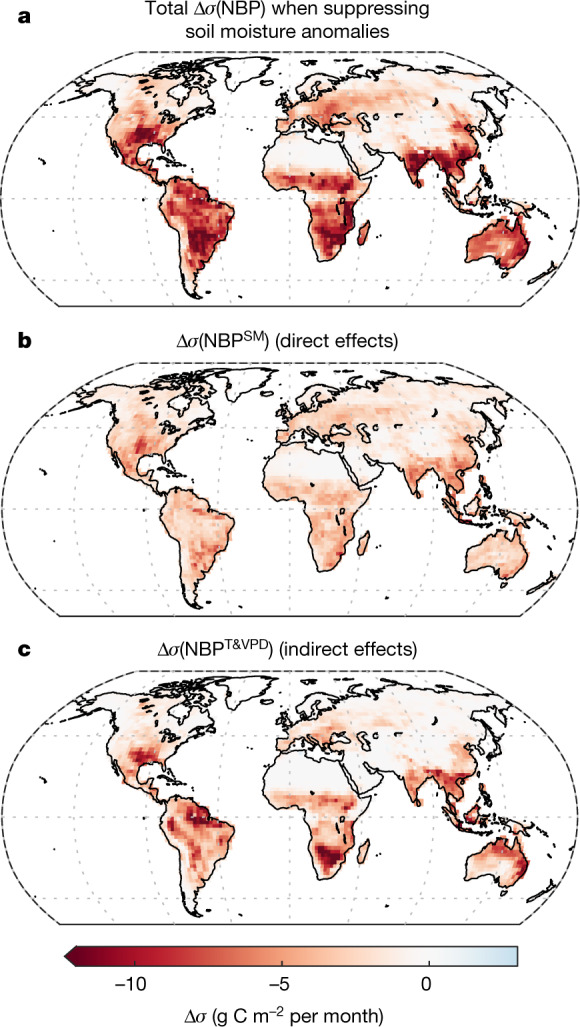
Fig. 2. Direct and indirect soil moisture effects on NBP variability.

a, Change in annual NBP standard deviation (∆σ) when prescribing seasonal soil moisture. b, Change caused by a direct response to the suppressed soil moisture (SM) variability. c, Change caused by the reduced variability of temperature (T) and VPD (that is, the indirect effects of suppressing soil moisture variability). Negative values in a–c indicate a decrease of the variability in experiment A compared to CTL. The median across the four models is shown.
