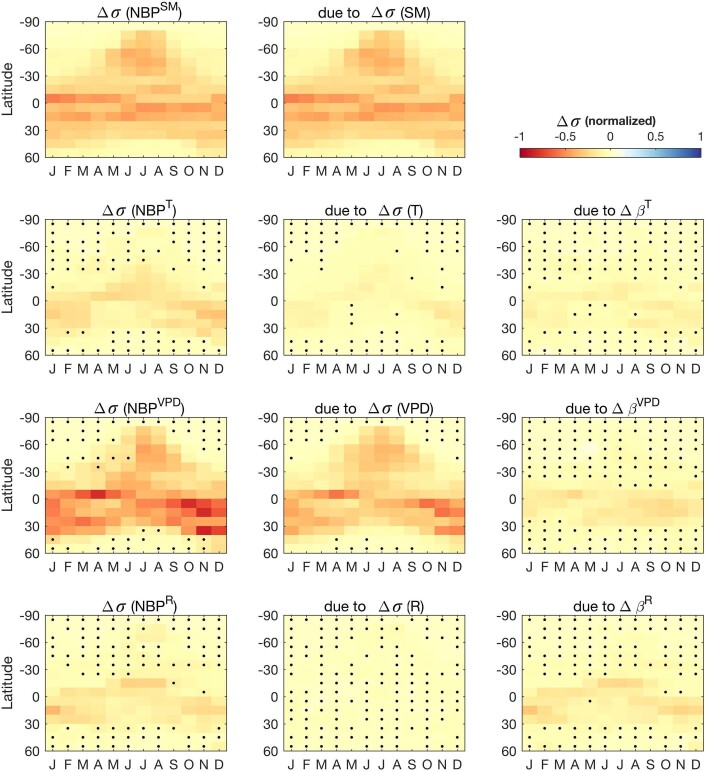
Extended Data Fig. 4. Change in annual NBP variability between CTL and experiment A.
Evaluation of the latitudinal change in NBP standard deviation (Δσ) between CTL and experiment A, decomposed by meteorological driver according to the sensitivity analysis. Negative values indicate a decrease of the NBP variability in experiment A compared to CTL. The middle and right columns indicate how much of this change is due to a change in the variance of the meteorological driver between experiment A and CTL, or due to a change in the sensitivity of NBP to that driver respectively (also see equation (1)). The results for each model are normalized by the model’s NBP standard deviation (calculated across the entire space–time domain) and the median across models is depicted. Black dots indicate that at least one model disagrees on the sign of the change.

