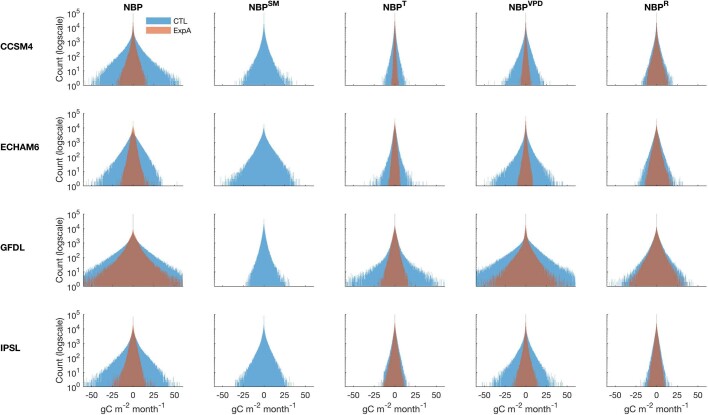
Extended Data Fig. 5. NBP anomalies in CTL and experiment A.
Distributions (all grid points, at all time steps) of modelled NBP anomalies (left column) and their decomposition into meteorological drivers with the sensitivity analysis (other columns) for the control experiment (CTL) and the experiment with only seasonal soil moisture (ExpA). Rows correspond to each of the four climate models. Note the logarithmic scale on the vertical axis. By construction, there are no soil moisture-driven NBP anomalies in experiment A in the second column (because seasonal soil moisture is prescribed in this experiment). The magnitude of the temperature-driven and VPD-driven NBP anomalies (third and fourth columns) is substantially reduced in experiment A (as a result of soil moisture–atmosphere feedback mechanisms).

