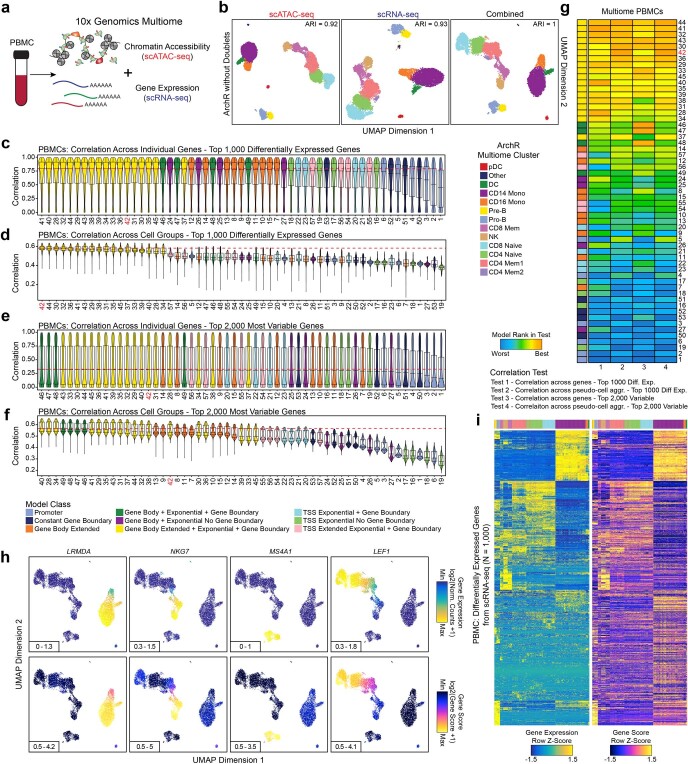
Extended Data Fig. 7. Confirmation of gene score model performance using paired scATAC-seq and scRNA-seq data from the same single cells.
a, Schematic of 10x Genomics Multiome profiling of scATAC-seq and scRNA-seq in the same single cells. b, UMAPs of Multiome data from PBMCs (N = 9,702 cells) with removal of ArchR-identified doublets using (left) iterative LSI of scATAC-seq data, (middle) iterative LSI of scRNA-seq data, and (right) iterative LSI of combined scATAC-seq and scRNA-seq. Cells are colored by clusters identified from the combined analysis. Adjusted Rand Index (ARI) of clusters identified from (left) scATAC-seq and (middle) scRNA-seq compared to the combination are shown in the top right of each plot. c-f, Distribution of Pearson correlations of inferred gene score and aligned gene expression for (c,e) each gene or (d,f) each cell group across groups of 100 cells (N = 500 groups). Distributions are either presented for (c,d) the top 1,000 differentially expressed genes or (e,f) the top 2,000 most variable genes for each of the 57 gene score models tested. See Extended Data Fig. 6 for further details. g, Heatmaps summarizing the accuracy (measured by Pearson correlation) across all models for both the top 1,000 differentially expressed and top 2,000 variable genes for paired scATAC-seq and scRNA-seq data. Each entry is colored by the model rank in the given test as described below the heatmap. The model class is indicated to the left of each heatmap. h, UMAPs of scATAC-seq data from the Multiome PBMCs dataset (N = 9,702 cells) colored by (bottom) inferred gene scores or (top) gene expression for several marker genes. i, Heatmaps of (left) gene expression or (right) gene scores for the top 1,000 differentially expressed genes (selected from scRNA-seq) across all cell types from the paired scATAC-seq and scRNA-seq data.

