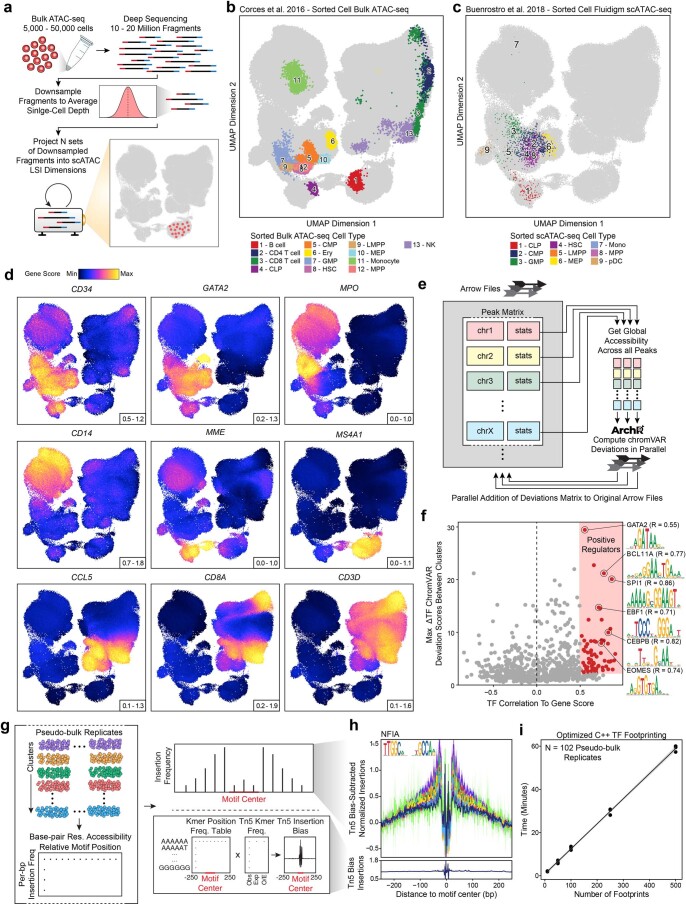
Extended Data Fig. 8. Analysis of the large hematopoiesis scATAC-seq dataset.
a, Schematic for the projection of bulk ATAC-seq data into an existing single-cell embedding using LSI projection. Bulk ATAC-seq data (10–20 million fragments) is down sampled to a fragment number corresponding to the average single-cell experiment, and LSI-projected into the single-cell subspace. b, LSI projection of bulk ATAC-seq data from diverse hematopoietic cell types into the scATAC-seq embedding of the hematopoiesis dataset. c-d, UMAP of scATAC-seq data from the hematopoiesis dataset (N = 215,031 cells) colored by (c) sorted cells processed with the Fluidigm C1 system or (d) inferred gene scores for marker genes of hematopoietic cells. e, Schematic of the scalable chromVAR method implemented in ArchR. ArchR computes global accessibility within each peak and then computes chromVAR deviations for each sample independently. f, Dot plot showing the identification of positive TF regulators through correlation of chromVAR TF deviation scores and inferred gene scores in cell groups (Correlation > 0.5 and Deviation Difference in the top 50th percentile). These TFs were additionally filtered by the maximum observed deviation score difference observed across each cluster average to remove TFs that are correlated but do not have large accessibility changes in hematopoiesis. g, Schematic of TF footprinting with Tn5 bias correction in ArchR. Base-pair resolution insertion coverage files from sample-aware pseudo-bulk replicates are used to compute the insertion frequency around each motif for each replicate. For each motif, the total observed k-mers relative to the motif center per bp are identified. This k-mer position frequency table can then be multiplied by the individual sample Tn5 k-mer frequencies to compute the Tn5 insertion bias per replicate. h, TF footprint for the NFIA motif. Lines are colored by cluster identity from the hematopoiesis dataset shown in Fig. 3b. i, Benchmarking of run time for TF footprinting with ArchR for the 102 sample-aware pseudo-bulk replicates from the hematopoiesis dataset.

