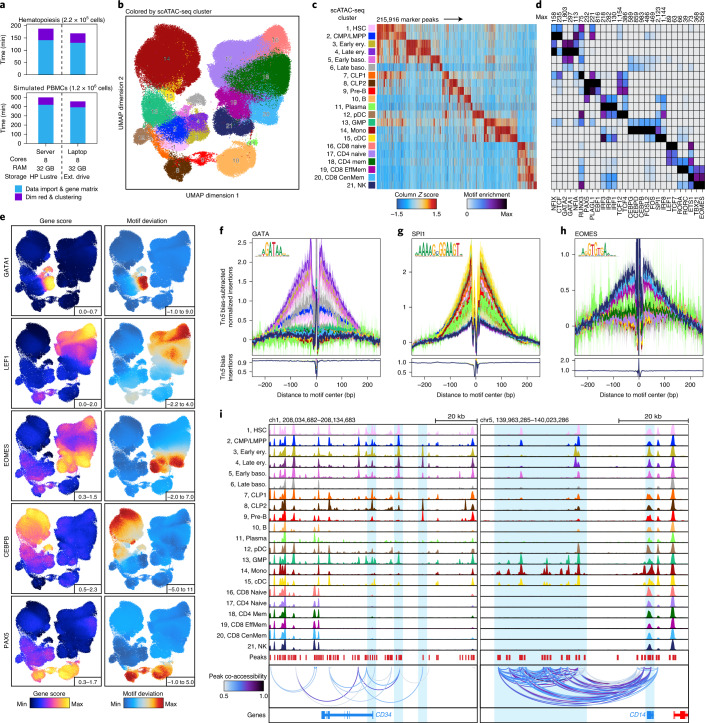
Fig. 3. ArchR enables comprehensive analysis of massive-scale scATAC-seq data.
a, Runtimes for ArchR-based analysis of over 220,000 and 1,200,000 single cells, respectively, using a small-cluster-based computational environment (32 GB of RAM and eight cores with HP Lustre storage) and a personal MacBook Pro laptop (32 GB of RAM and eight cores with an external (ext.) USB hard drive). Color indicates the relevant analytical step. b, UMAP of the hematopoiesis dataset colored by the 21 hematopoietic clusters. UMAP was constructed using LSI estimation with 25,000 landmark cells. c, Heatmap of 215,916 ATAC-seq marker peaks across all hematopoietic clusters identified with bias-matched differential testing. Color indicates the column Z score of normalized accessibility. d, Heatmap of motif hypergeometric enrichment-adjusted P values within the marker peaks of each hematopoietic cluster. Color indicates the motif enrichment (−log10 (P value)) based on the hypergeometric test. e, Side-by-side UMAPs of gene scores (left) and motif deviation scores for ArchR-identified TFs (right), for which the inferred gene expression is positively correlated with the chromVAR TF deviation across hematopoiesis. f–h, Tn5 bias-adjusted TF footprints for GATA, proto-oncogene SPI1 and EOMES motifs, representing positive TF regulators of hematopoiesis. Lines are colored by the 21 clusters shown in c. i, Genome accessibility track visualization of marker genes with peak co-accessibility. Left, CD34 genome track (chromosome (chr)1, 208,034,682–208,134,683) showing greater accessibility in earlier hematopoietic clusters (1–5, 7–8 and 12–13). Right, CD14 genome track (chr5, 139,963,285–140,023,286) showing greater accessibility in earlier monocytic clusters (13–15).

