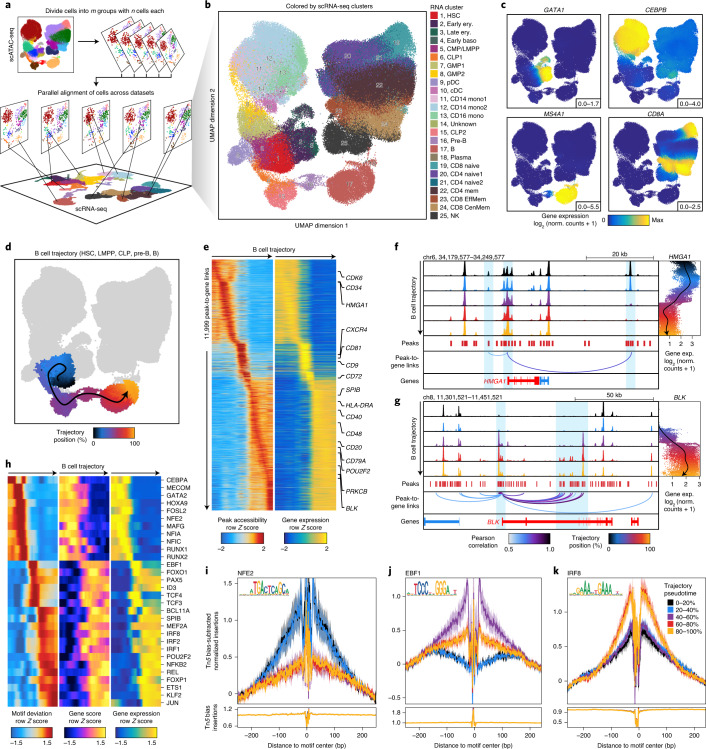
Fig. 4. Integration of scATAC-seq and scRNA-seq data by ArchR identifies gene regulatory trajectories of hematopoietic differentiation.
a, Schematic of scATAC-seq alignment with scRNA-seq data in m slices of n single cells. These slices are independently aligned to a reference scRNA-seq dataset and then the results are combined for downstream analysis. This integrative design facilitates rapid large-scale integration with low memory requirements. b–d, UMAPs of scATAC-seq data from the hematopoiesis dataset colored by alignment to previously published hematopoietic scRNA-seq-derived clusters (b), integrated scRNA-seq gene expression for key marker TFs and genes (c) or cell alignment to the ArchR-defined B cell trajectory (d). In d, the smoothed arrow represents a visualization of the interpreted trajectory (determined in the LSI subspace) in the UMAP embedding. e, Heatmap of 11,999 peak-to-gene links identified across the B cell trajectory with ArchR. f,g, Genome track visualization of the HMGA1 locus (chr6, 34,179,577–34,249,577) (f) and the BLK locus (chr8, 11,301,521–11,451,521) (g). Single-cell gene expression (exp.) across pseudotime in the B cell trajectory is shown to the right. Inferred peak-to-gene links for distal regulatory elements across the hematopoiesis dataset are shown below. h, Heatmap of positive TF regulators for which gene expression is positively correlated with chromVAR TF deviation across the B cell trajectory. i–k, Tn5 bias-adjusted TF footprints for nuclear factor, erythroid (NFE)2 (i), early B cell factor (EBF)1 (j) and interferon regulatory factor (IRF)8 (k) motifs, representing positive TF regulators across the B cell trajectory. Lines are colored by the position in pseudotime of B cell differentiation.

