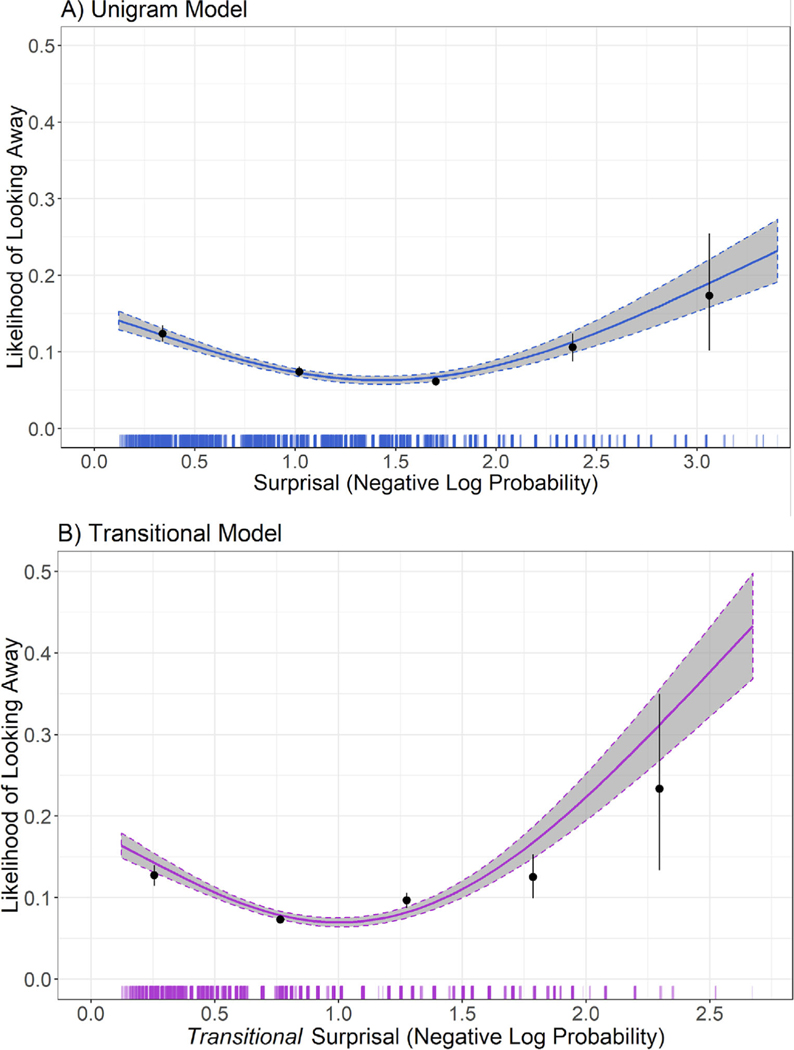
Figure 3.
Look-away likelihood as a function of (A) unigram and (B) transitional surprisal (predictability). Curves represent the fit of a Generalized Additive Model (with 95% confidence intervals) linking predictability to probability of looking away. Low values on the y-axis indicate increased attentional preference, whereas low values on the x-axis indicate increased predictability (decreased surprisal). Dots represent raw data binned into 5 bins (± SE) equally spaced across the x-axis. Vertical lines on the x-axis represent count of data points collected at each predictability value.

