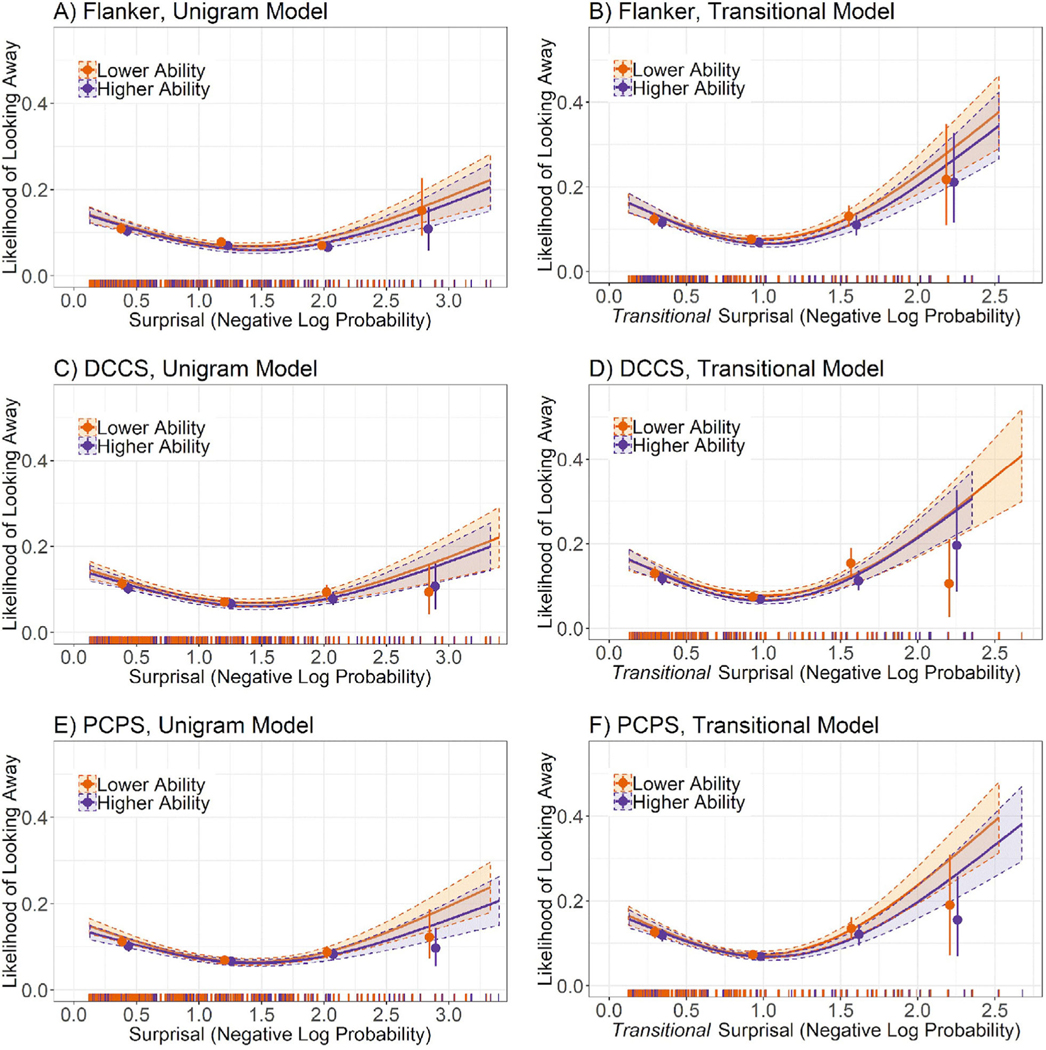
Figure 5.

Look-away likelihood as a function of (A, C, E) unigram and (B, D, F) transitional surprisal (predictability) for Lower Ability and Higher Ability groups for NIH Toolbox tasks. Measures included Flanker Inhibitory Control and Attention Test (Flanker), Dimensional Change Card Sort (DCCS), and Picture Comparison Processing Speed (PCPS). Curves represent the fit of separate Generalized Additive Models (with 95% confidence intervals) linking predictability to probability of looking away separately for each group. Dots represent raw data binned into 5 bins (± SE) equally spaced along the x-axis. Vertical lines on the x-axis represent count of data points collected at each predictability value.
