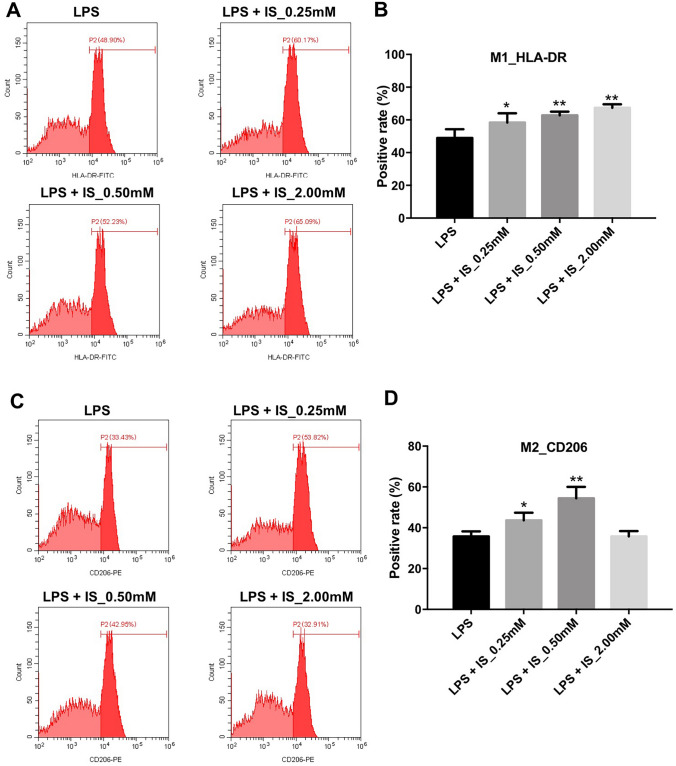
Fig. 3.
IS promoted M1 macrophage polarization in LPS-stimulated macrophages. THP-1 cells were exposed to PMA (160 nM) for 48 h, and then incubated in PMA-free medium for 24 h, following treated with different concentrations of IS (0, 0.25, 0.5, or 2 mM) and LPS (10 μg/mL) for 24 h. a, b Representative FACS plots of M1 macrophages (HLA-DR). Percentages of HLA-DR-positive cells were detected by flow cytometry. c, d Representative FACS plots of M2 macrophages (CD206). Percentages of CD206-positive cells were detected by flow cytometry. *P < 0.05, **P < 0.01 vs. 10 μg/mL LPS group

