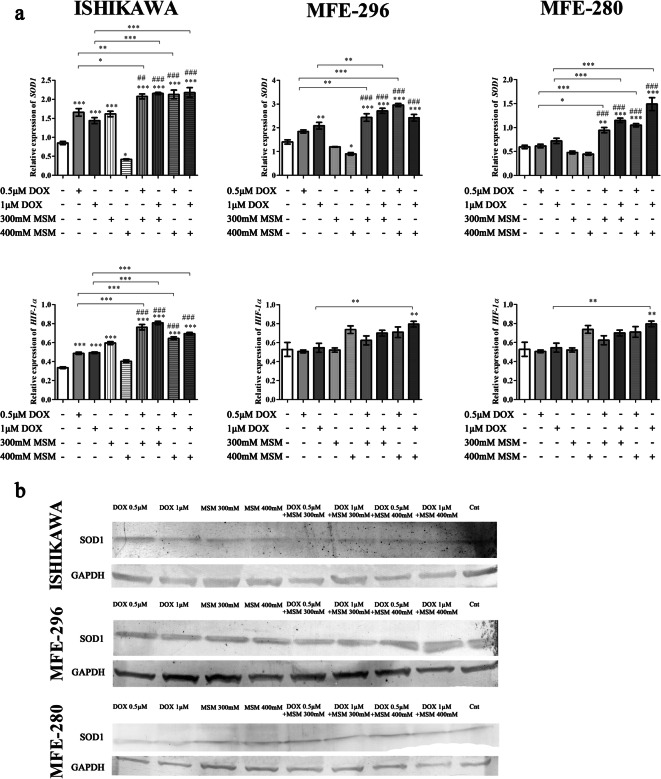
Fig. 4.
a The expression of SOD1 and HIF-1α after MSM and DOX treatment. The expression was evaluated with RTqPCR. The results are expressed as a relative expression. b The expression of SOD1 on protein level. The expression was evaluated with Western blot and presented as representative results. p < 0.05 was considered statistically significant. *p < 0.05, **p < 0.01, ***p < 0.001 as compared to Cnt. ##p < 0.01, ###p < 0.001 as compared to MSM-treated cells. MSM methylsulfonylmethane, DOX doxorubicin, Cnt control

