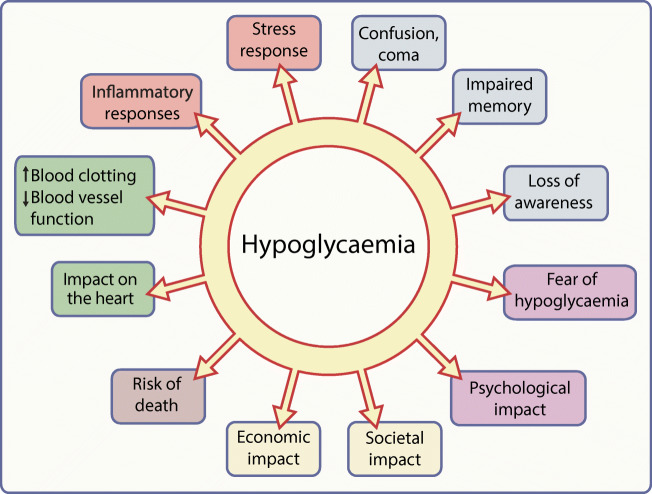
Fig. 1.
A graphical summary of the potential consequences of hypoglycaemia. Elements of the stress response to a hypoglycaemic episode are shown in orange text boxes; other colours indicate different classes of possible consequences of hypoglycaemic episodes and of hypoglycaemia itself (blue, neurological/cognitive; purple, psychological; yellow, socioeconomic; brown, mortality; green, cardiovascular). This figure is available as a downloadable slide

