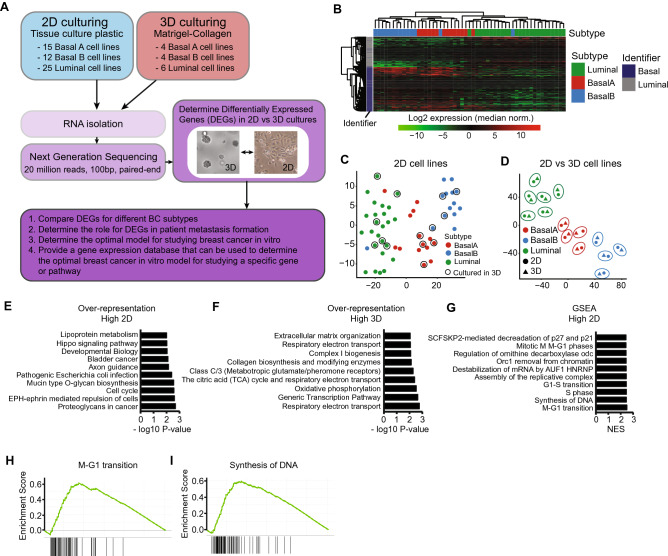
Figure 1.
RNA sequencing of breast cancer cell lines cultured in 2D and 3D environments. (A) Experimental overview. RNA was isolated from cell lines cultured in 2D and 3D conditions (see Methods section for more details), upon which next generation sequencing was performed. Cell line specific Differentially Expressed Genes (DEGs) were selected based on log2 fold change > 1 or < − 1. Subtype specific DEGs were determined using a paired cell line analysis and selected if the parametric p-value < 0.01. See “Methods” section for further details. (B) Hierarchical clustering (complete linkage, correlation) of log2 expression levels of previously defined basal and luminal identifiers29 in 2D cultured cell lines. For every gene, expression levels were normalized to the median cell line expression. (C) T-sne of all cell lines cultured in 2D based on log2 normalized reads from all detected genes. Encircled cell lines were also cultured in 3D in this study. (D) T-sne of cell lines cultured in both 2D and 3D conditions based on log2 normalized reads from all detected genes. 2D and 3D conditions of the same cell line are encircled. (E) Top 10 over-represented pathways in DEGs higher expressed in 2D cultures. DEGs were determined using paired analysis for all cell lines, p < 0.01. (F) Top 10 over-represented pathways in DEGs higher expressed in 3D cultures. DEGs were determined using paired analysis for all cell lines, p < 0.01. (G) Top 10 enriched pathways higher expressed in 2D cultures using a ranked gene set enrichment analysis (GSEA). (H) and (I) Examples of GSEA of pathways enriched in 2D cultures. The enrichment score (ES) represents the degree to which a pathway is overrepresented at the top or bottom of the gene ranking (add ref Subramanian, PNAS, 2005).

