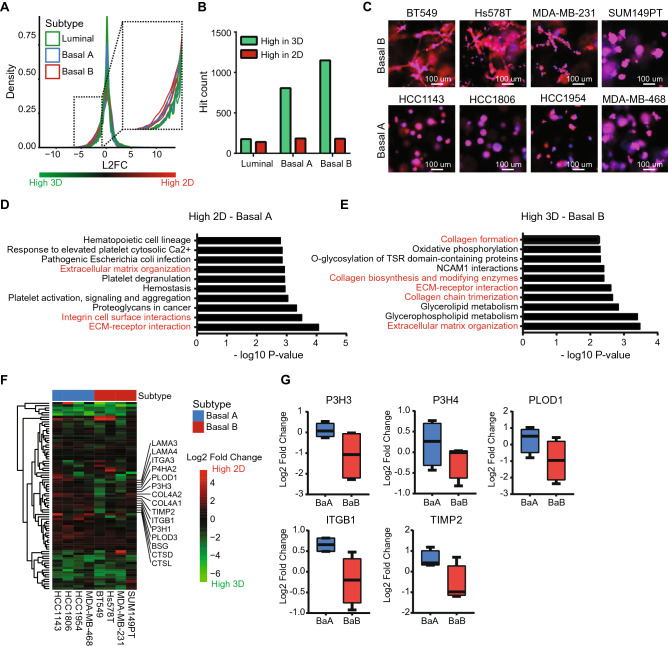
Figure 2.
Subtype specific differences in 2D and 3D breast cancer cultures. (A) Density plot of log2 fold change in gene expression comparing 2D to 3D cultures of 14 cell lines (4 basal A, 4 basal B and 6 luminal). (B) Significantly DEG count for different subtypes based on paired analysis and p < 0.01. (C) Cellular morphology of basal A and basal B cell lines cultured in 3D. (D) Top 10 over-represented pathways in the high 2D DEGs in basal A cell lines. Migration and invasion related pathways are highlighted in red. DEGs were determined by paired analysis of basal A cell lines, p < 0.01. (E) Top 10 over-represented pathways in the high 3D DEGs in basal B cell lines. Migration and invasion related pathways are highlighted in red. DEGs were determined by paired analysis of basal B cell lines, p < 0.01. (F) Heatmap (complete linkage, Euclidean distance) of log2 fold change in expression of genes in the extracellular matrix organization pathway comparing 2D to 3D cultures. (G) Log2 fold change of expression levels of genes in the extracellular matrix pathway comparing 2D to 3D cultures in basal A and basal B cell lines. Selected genes were higher expressed in 2D in the basal A cell lines, but higher expressed in 3D in the basal B cell lines. Log2 fold change was determined using a paired analysis per subtype.

