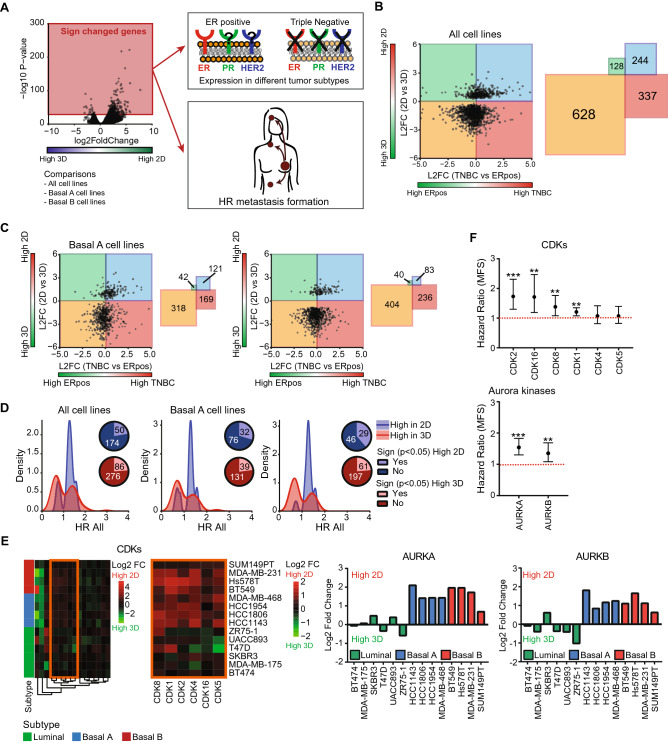
Figure 3.
Role of DEGs in breast cancer aggressiveness and metastasis formation. (A) Significantly DEGs comparing all cell lines, basal A cell lines or basal B cell lines were selected using a paired cell line analysis per subtype, p < 0.01. For these genes, the expression in different tumor subtypes as well as the relation to metastasis formation was determined. (B) Log2 fold change of DEGs (paired analysis of all cell lines, p < 0.01) comparing 2D to 3D cell cultures versus log2 fold change comparing TNBC to ER positive primary tumors (left). Number of genes in each quadrant (right). (C) Log2 fold change of DEGs (paired analysis of basal A and basal B cells, p < 0.01) comparing 2D to 3D cell cultures versus log2 fold change comparing TNBC to ER positive breast tumors (left). Number of genes in each quadrant (right). (D) Density plot of DEGs (paired analysis of all, basal A and basal B cell lines respectively, p < 0.01) with a significant hazard ratio (HR). Blue = density plot for DEGs with increased expression in 2D cultures. Red = density plot for DEGs with increased expression in 3D cultures. Venn diagrams show the fraction of DEGs showing a significant HR. (E) Heatmap (Euclidean distance, complete linkage) of log2 fold change of CDK expression levels comparing 2D to 3D cultures (orange cluster is enlarged on the right) and log2 fold change of aurora kinase A and B comparing 2D to 3D cultures for different cell lines. (F) Hazard ratios and 95% confidence interval (CI) for CDKs higher expressed in 2D and aurora kinase A and B.

