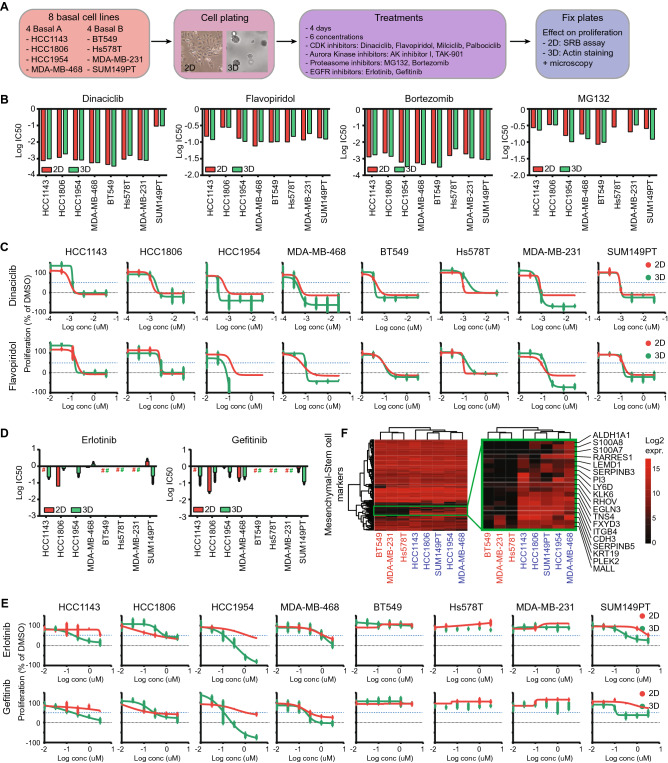
Figure 4.
Effect of DEG inhibitors on cell line proliferation in 2D and 3D. (A) Experimental setup. 4 basal A and 4 basal B cell lines were plated in 2D and 3D conditions, after which they were treated with 6 different concentrations of CDK, Aurora Kinase, Proteasome or EGFR inhibitors. 4 days after treatment, cells were fixed and proliferation was assessed. (B) Log IC50 (uM) for CDK inhibitors dinaciclib en flavopiridol and proteasome inhibitors bortezomib and MG132 in 2D and 3D cultures of basal A and basal B cell lines. (C) Dose response curves of dinaciclib en flavopiridol in 2D and 3D cultures of basal A and basal B cell lines. Mean + stdev for technical duplicates in 2D cultures. Mean + stdev for technical quadruplicates in 3D cultures. (D) Log IC50 of EGFR inhibitors erlotinib and gefitinib in basal A and basal B cell lines. (E) Dose–response curves of erlotinib and gefitinib in 2D and 3D cultures of basal A and basal B cell lines. Mean + stdev for technical duplicates in 2D cultures. Mean + stdev for technical quadruplicates in 3D cultures. (F) Heatmap (complete linkage, Euclidean distance) of log2 expression of mesenchymal-stem cell markers in basal A and basal B cell lines. Cell line color indicates 3D invasiveness; red = invasive, blue = non-invasive.

