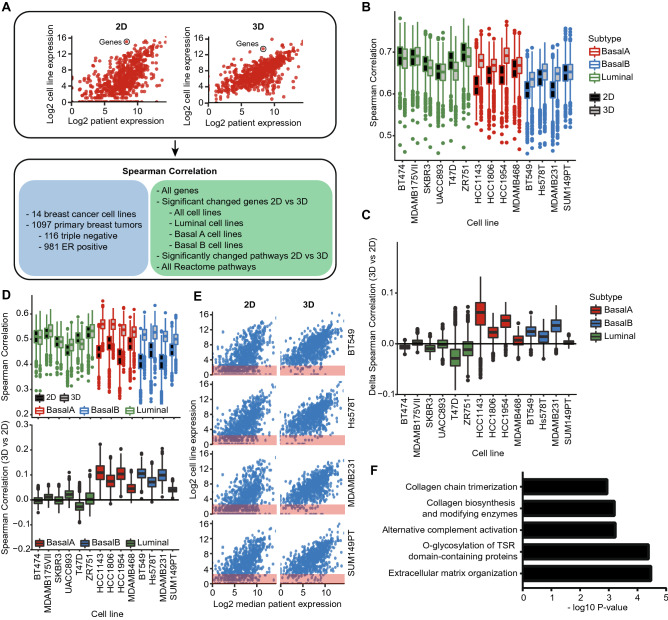
Figure 5.
Comparison the transcriptomes of 2D and 3D cell culture models with patient derived primary tumor transcriptomes. (A) Analysis overview. Spearman correlations were calculated between the different transcriptomes using log2 normalized gene expression levels taking into consideration cell line subtypes, tumor subtypes and different gene sets. (B) Spearman correlation of log2 normalized RNA expression levels between cell lines and patient primary breast tumors (n = 1097). Boxes represent median and interquartile range of all tumor correlations. All genes and all tumors (irrespective of subtype) were included in the correlation calculations. (C) Difference in spearman correlation comparing 2D and 3D cell line cultures matched by patient tumor. All genes and all tumors were included in the correlation calculations. Boxes represent median and interquartile range of the difference in spearman correlation for all tumors. (D) Spearman correlation of log2 normalized RNA expression levels of basal B DEGs (paired analysis, p < 0.01) between cell lines and patient primary breast tumors (n = 1097). Boxes represent median and interquartile range of all tumor correlations. Only DEGs comparing 2D and 3D cultures for the basal B cell lines were included in the correlation calculations (top). Difference in spearman correlation comparing 2D and 3D cell line cultures matched by patient tumor. Only DEGs comparing 2D and 3D cultures for the basal B cell lines were included in the correlation calculations (bottom). Boxes represent median and interquartile range of the difference in spearman correlation for all tumors. (E) Log2 normalized RNA expression levels of basal B DEGs comparing 2D to 3D cultures (paired analysis, p < 0.01) in basal B cell lines and TCGA patient primary breast tumors. Red squares: genes with log2 RNA expression < 2. (F) Top 5 pathways of over-representation analysis of basal B DEGs comparing 2D to 3D cultures (paired analysis, p < 0.01) not or low expressed in 2D cultures and higher expressed in 3D cultures.

