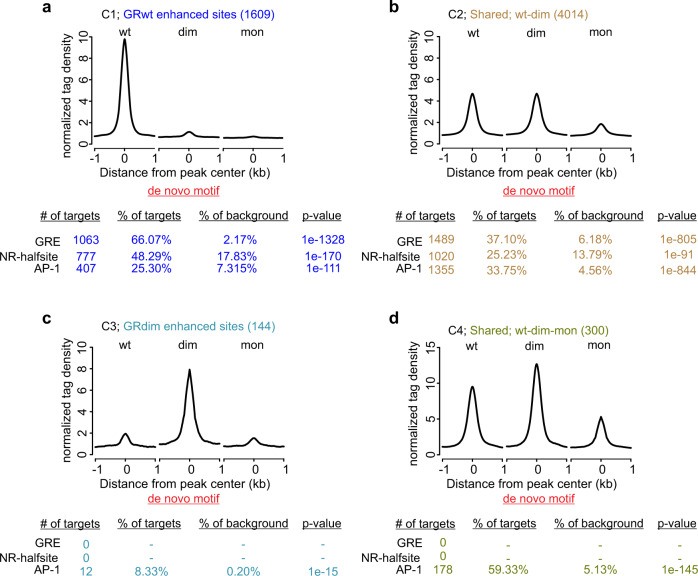
Fig. 3. Chromatin binding and de novo motif analyses of GRwt, GRdim, and GRmon.
a–d Aggregate plots of +Dex GR binding (α-GFP) of each receptor type for each cluster. All aggregate plots normalized to 10 million reads, and further to local tag density (tags per site per bp). De novo motif analysis shows the percentage of sites with a motif and the calculated background percentage from 50 K random sites (with matched GC% content). p-value of the motif enrichment is shown. Source data are provided as a Source Data file.

