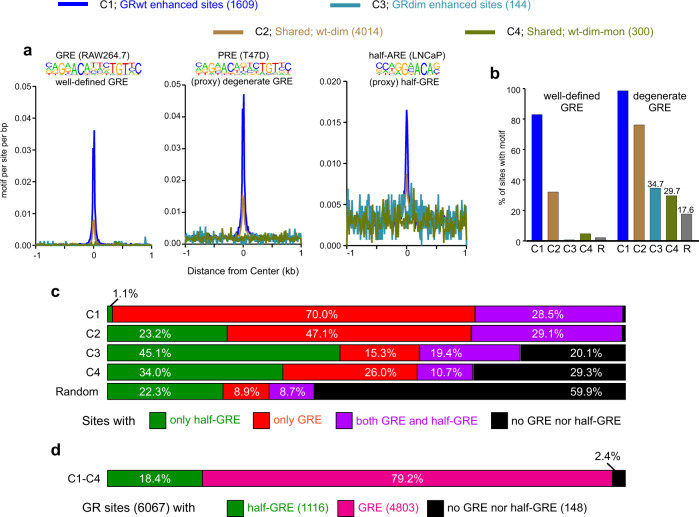
Fig. 4. Pre-defined motif analyses.
a Motif enrichment of a well-defined GRE (HOMER motif gre-raw.motif), a proxy for a more degenerate GRE (HOMER motif pr.motif) and a proxy for a half-GRE (HOMER motif ar-half.motif) at GR ChIP peaks from each cluster (C1–C4). Position-weight matrix (PWM) logo for each GRE shown above each aggregate plot. All aggregate plots normalized to 10 million reads, and to motif per site per bp. b The percentage of sites within each cluster (C) that contain each pre-defined motif as well as the percentage at 2000 randomly chosen (R) ATAC peaks from the Dex-treated GRwt cell line. c The percentage of GR peaks with only a full GRE (red color), only a half-GRE (green color), both a full GRE and half-GRE (purple color), or no GRE nor half-GRE (black color). The degenerate full GRE and half-GRE in a were used to determine the percentages. d The percentage of all GR peaks (6067) that contain half-GRE (green), full GRE (magenta) or no half nor full GRE (black). Source data are provided as a Source Data file.

