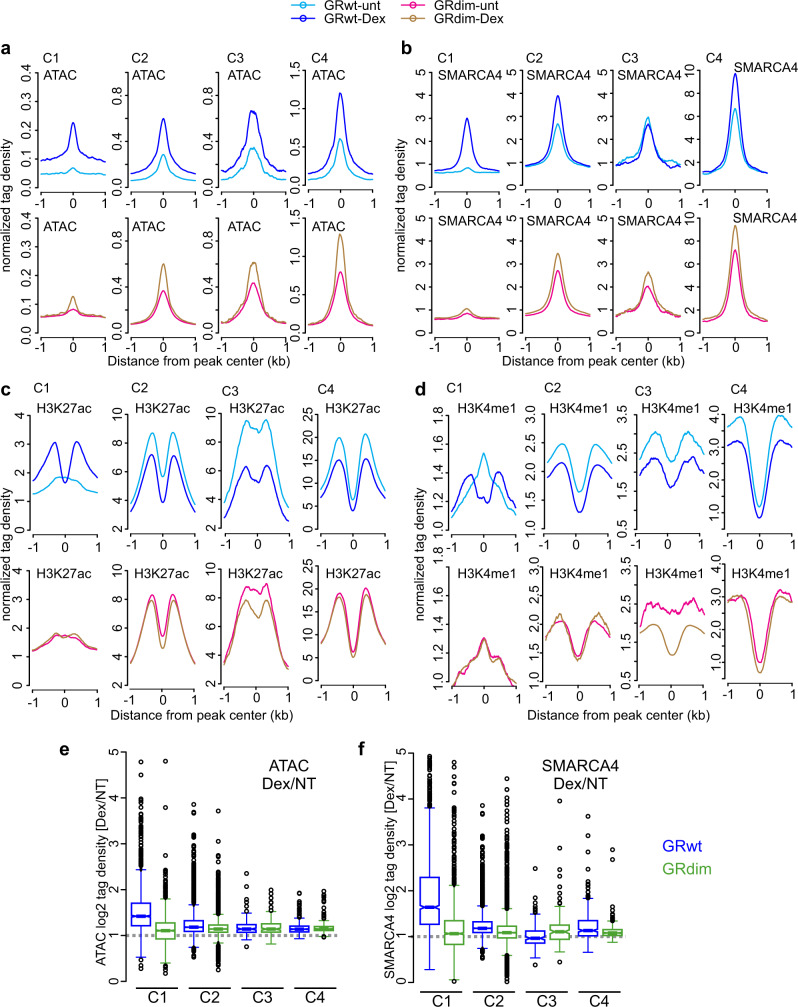
Fig. 6. GRwt can bind to closed chromatin sites and increase enhancer accessibility and activity.
a–d Aggregate plots represent ATAC-seq (a), SMARCA4 (b), H3K27ac (c) and H3K4me1 (d). ChIP-seq changes for each cluster; color indicates treatment and GR type. e, f Box plots represent Dex/NT comparison of normalized log2 tag density of ATAC-seq (e) and SMARCA4 ChIP-seq (f) between of GRwt (blue) and GRdim (green) at C1–C4 sites. C1 n = 1609, C2 n = 4014, C3 n = 144, C4 n = 300 sites. All box plots are normalized to total of 10 million reads. Box plots were generated with Tukey method with interquartile range (IQR) depicting the 25th, 50th and 75th percentile as box with the median as black bar. Notches depicting the confidence of the median. The whiskers extend 1.5xIQR beyond the box, and outliers depicted as circles extend beyond the 1.5xIQR. Source data are provided as a Source Data file.

