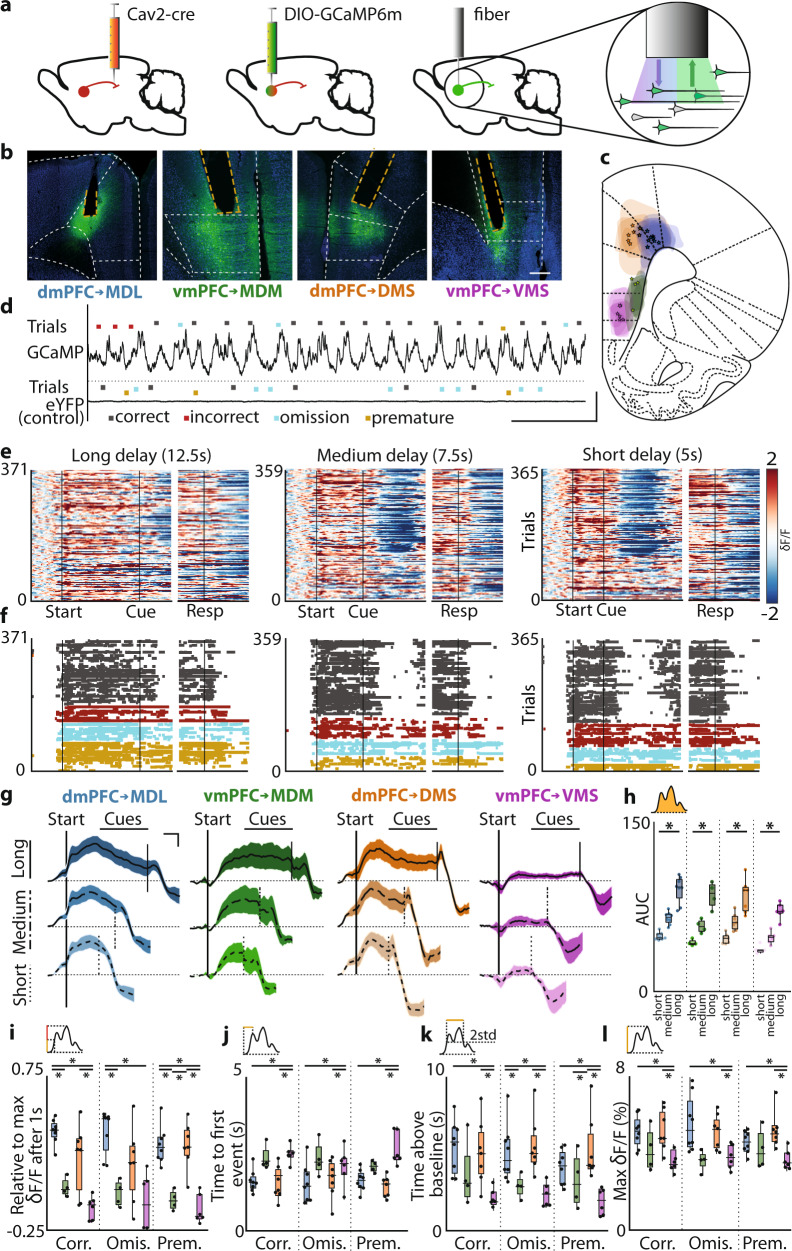
Fig. 4. mPFC projections show distinct activation during inhibitory control.
a Injection and fiber placement protocol. b Representative example of GCaMP6m-expression and fiber placement. c Expression and fiber placement at AP + 2.76. Shaded areas: GCaMP6-expression. Stars: fiber tips. d Example traces from GCaMP6m-expressing and eYFP-expressing animals. Dots represent trialstarts. e Variable delay trials from one rat, by the trial outcome. Left two plots: 5 s delay trials, synchronized on trialstart (left) or response (right). Middle: 7.5 s delay. Right: 12.5 s delay. δF/F z-scored to trial baseline (5 s–1 s before trialstart). f Same as e, color-coded by the outcome. Dots represent frames with δF/F > 2std above baseline. Colors same as in d. g Average correct trial fluorescence. h Area under the curve (AUC) during the correct trial delay. Delay, short vs. long, pMDL = 0.0002; pMDM = 0.014; pDMS = 0.0006; pVMS = 0.0016. i Fluorescence rise kinetics 1 s after trialstart, a fraction of peak fluorescence. Correct, pMDL-MDM < 0.0001; pDMS-VMS < 0.0001, pMDL-VMS = 0.0095; Omissions, pMDL-MDM = 0.002, pMDL-VMS = 0.0029; Premature, pMDL-MDM = 0.0006, pMDL-VMS = 0.0001, pDMS-MDM = 0.0017, pDMS-VMS = 0.0002. j Time to the first synchronous event. Correct, pMDL-VMS = 0.0007, pDMS-VMS = 0.006; Omissions, pMDL-VMS = 0.0344, pDMS-VMS = 0.0344; Premature pMDL-VMS = 0.0102, pDMS-VMS = 0.002. k Total time signal > baseline + 2std. Correct pMDL-VMS = 0.0093, pDMS-VMS = 0.0241; Omissions pMDL-MDM = 0.0285, pMDL-VMS = 0.0127, pDMS-VMS = 0.0285; Premature pMDL-VMS = 0.0008, pMDL-VMS = 0.0383, pDMS-VMS = 0.0008. l Peak fluorescence during the delay. Correct, pMDL-VMS = 0.0215, pDMS-VMS = 0.0493; Omissions, pMDL-MDM = 0.0448, pMDL-VMS = 0.034, pDMS-VMS = 0.034; Premature, pMDL-VMS = 0.0294, pDMS-VMS = 0.0078. Dots represent individual animals in h–l. Shades in g represent SEM. Scale in e is the same for all heatplots. Boxplots in h–l: center line, median; edges, 1st and 3rd quartile; whiskers, range. Friedman with Dunn’s used in h. Kruskal–Wallis with uncorrected Dunn’s and FDR used in i–l. Significance: *p < 0.05. Scales: (a) 400 μm, (d) horizontal 50 s, vertical 10% δF/F, (g): horizontal 2 s, vertical 1% δF/F. Group sizes: MDL (n = 8 rats), MDM (n = 4), DMS (n = 7), VMS (n = 6).

