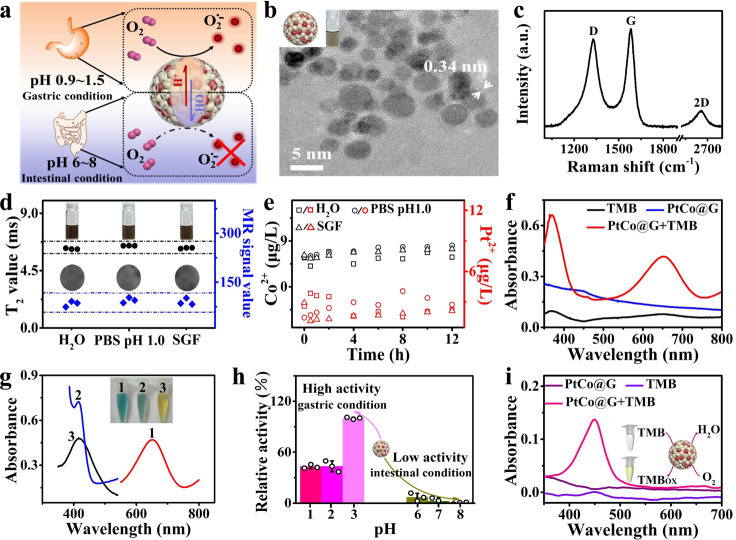
Fig. 1. Characterization of pH-responsive graphitic nanozyme.
a Schematic illustrating selective activated pH-responsive oxidase-like activity of PtCo@G in gastric acid conditions. b TEM image of PtCo@G. Insert shows corresponding structure diagram of PtCo@G (including the PtCo nanocrystal core and graphitic shell) and digital photos of the PtCo@G solution. c Raman spectrum of PtCo@G. d The digital photos, MR T2 relaxivity, T2-weighted phantom images and corresponding quantitative data analysis on T2-weighted phantom images of PtCo@G in H2O, PBS (pH 1.0), and SGF after 12 h incubation. e Profiles for Co2+ and Pt2+ release from PtCo@G nanocrystals in H2O, PBS (pH 1.0), and SGF. f UV-Vis absorbance spectra of TMB in different reaction systems: TMB, PtCo@G, and PtCo@G + TMB in a pH 4.0 PBS buffer after 30 min incubation. g PtCo@G catalyzes the oxidation of various substrates to produce different color reactions. (1) TMB, (2) ABTS, and (3) OPD. Insert images show corresponding visual color changes. h Selective activated pH-responsive oxidase-like activity of PtCo@G under gastric acid conditions. i Oxidase-like activity of the PtCo@G in SGF. Insert images show corresponding visual color changes and the reaction between TMB and PtCo@G in SGF. The data indicate the means and SD from three parallel experiments. Source data are provided as a Source Data file.

