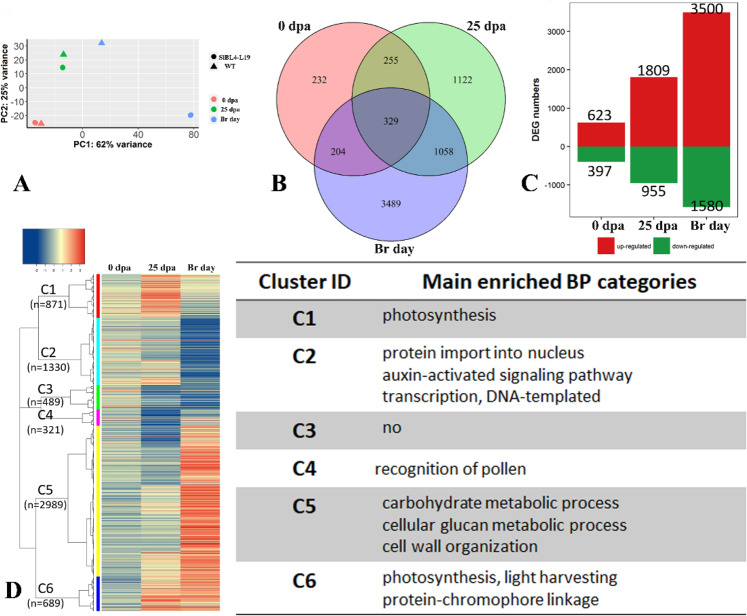
Fig. 5. The DEG analysis of SlBL4 RNAi line 19 compared with wild-type tomato.
A Principal component analysis (PCA) of gene expression data from the RNA-seq libraries. B Venn diagram of the differentially expressed genes (DEGs) between SlBL4 RNAi and wild-type plants at three different fruit pedicel stages. C Upregulated (red bar) and downregulated (green bar) DEGs between SlBL4 RNAi and wild-type plants at the three developmental stages of fruit pedicel. D Cluster analysis of DEGs at the three developmental stages of fruit pedicel

