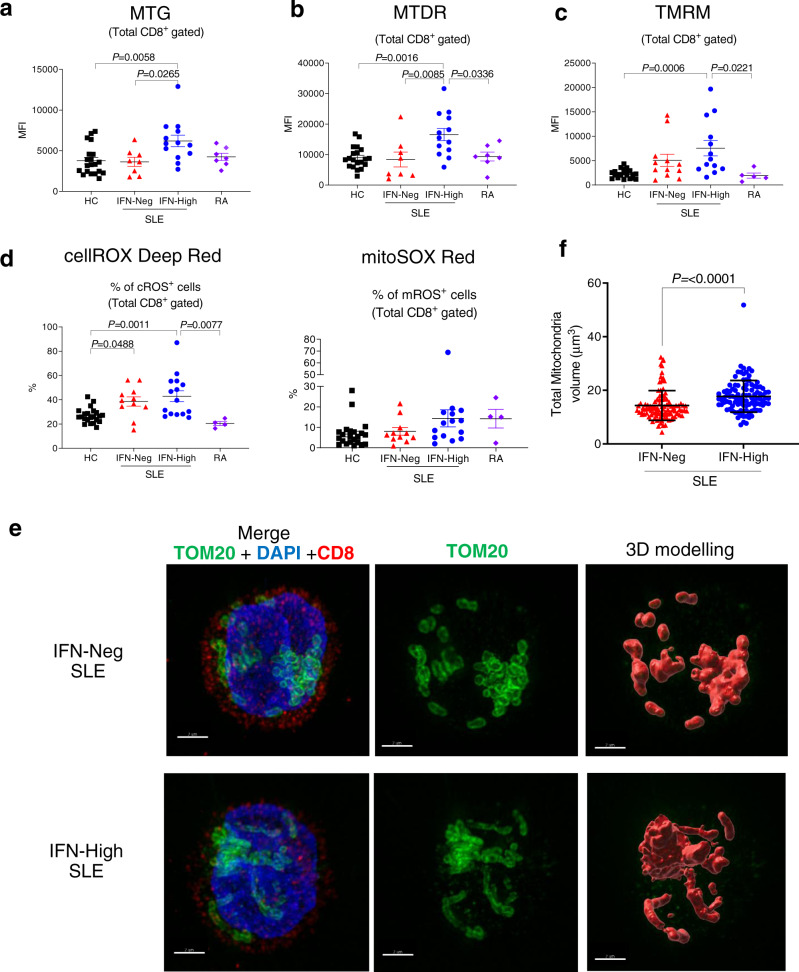
Fig. 2. Mitochondrial changes in total CD8+ T cells from patients with SLE.
Gated CD8+ T cells were stained with a MitoTracker green (MTG) (HC n = 20; IFN-Neg n = 8; IFN-High n = 13; RA n = 7); b membrane potential dependent-Mitotracker Deep Read (MTDR) (HC n = 20; IFN-Neg n = 8; IFN-High n = 13; RA n = 7); c Tetramethylrhodamine (TMRM). (HC n = 22; IFN-Neg n = 12; IFN-High n = 13; RA n = 5); Mean fluorescence intensity (MFI) data are shown. d Proportions of CD8+ T cells positive for cROS (cellROX Deep Red) and mROS (MitoSOX Red) are shown. (HC n = 22; IFN-Neg n = 12; IFN-High n = 13; RA n = 5); a–d Data presented as mean ± S.E.M. Each symbol represents an individual. e, f Isolated CD8+ T cells from IFN-Neg and IFN-High SLE patients were mounted on poly-l-lysine-coated coverslips, fixed and stained for TOM20 (green), CD8 (red) and DAPI (blue) as described in “Methods” section. Representative SIM images derived from maximal projection analysis (e) and total mitochondrial volume (f) of three independent samples per condition, each with at least 14 cells analysed (range 14–43 cells per sample). Scale bars, 2 mm. Data presented as mean ± S.E.M. a–d One-way ANOVA, f Two-tailed Mann–Whitney test; only significant differences are indicated. HC healthy controls, RA rheumatoid arthritis patients. Source data are for this figure provided as a Source Data file.

