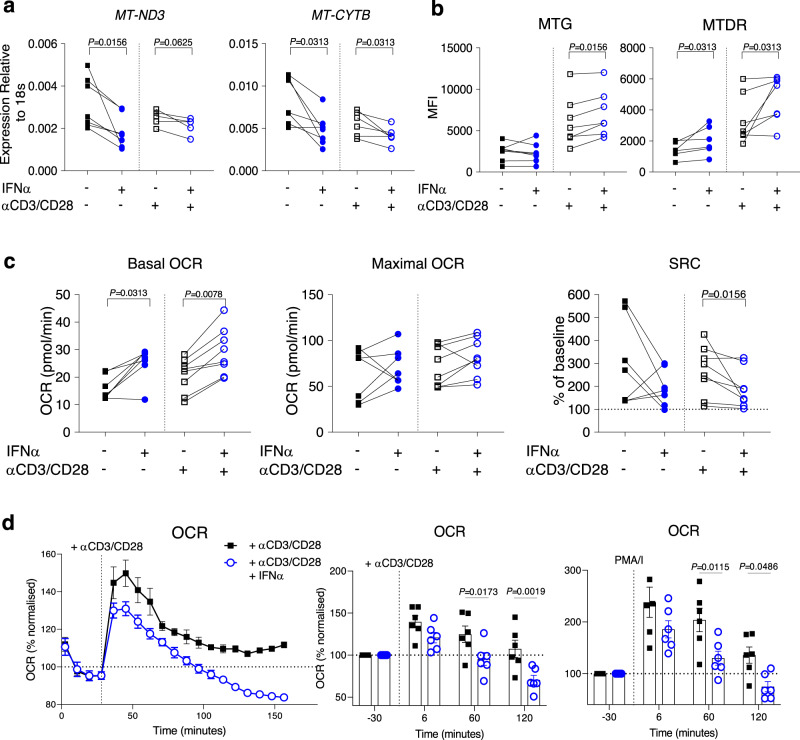
Fig. 4. Metabolic changes triggered by 7-day IFNα exposure and T cell activation.
a, b Purified CD8+ T cells from healthy donors treated with or without αCD3/CD28 beads in the presence or absence of 1000U/ml IFNα for 7 days. Mitochondria-encoded gene expression (n = 5–7) (a) and changes in mitotracker stainings (n = 6–7) (b) are shown. c, d PBMCs from healthy donors treated with or without αCD3/CD28 beads in the presence or absence of 1000U/ml IFNα for 7 days. CD8+ T cells were FACs-sorted and analysed using the extracellular flux assay. c Graphs showing the basal and maximal OCR levels under the different experimental conditions as indicated. Spare respiratory capacity (SRC) was normalized to basal level of each individual (n = 7–8). d Oxidative response of FACs-sorted CD8+ T cells upon re-stimulation with anti-CD3/CD28 beads or PMA/I injected during the extracellular flux assay. A representative graph (left panel) and levels (right panels) at different time points normalised to basal level of each individual are shown (n = 6). a–d Data presented as mean ± S.E.M. Each symbol represents one donor. a–c Two-tailed Wilcoxon matched-pairs signed rank test was utilized, d two-way ANOVA; only significant differences are indicated; MFI mean fluorescence intensity, MTG MitoTracker green, MTDR membrane potential dependent-Mitotracker Deep Read, MT-ND3 mitochondrially encoded NADH:Ubiquinone oxidoreductase core subunit 3, MT-CYTB mitochondrially encoded cytochrome B, PMA/I phorbol12-myristate13-acetate/Ionomycin. Source data for this figure are provided as a Source Data file.

