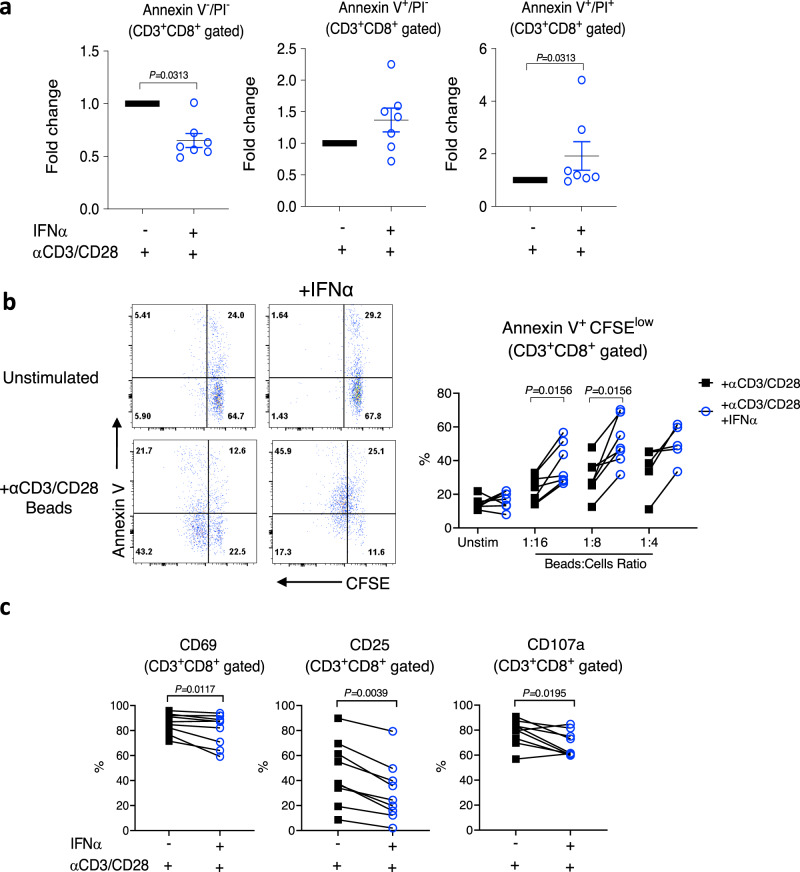
Fig. 5. Changes induced by 7-day exposure to IFNα and T cell activation.
PBMCs from HC were stimulated with αCD3/CD28 beads in the presence or absence of 1000U/ml of IFNα for 7 days. a αCD3/CD28 beads were removed from the culture and cells were left in culture for additional 48 h. Annexin V and propidium iodide (PI) staining of gated CD3+CD8+ cells was used to detect spontaneous cell death. Data shown are mean ± S.E.M of fold-change of each individual sample exposed to αCD3/CD28 beads only. Each dot represents one donor (n = 7). b, c αCD3/CD28 beads were removed from the culture and cells were rested overnight before labelling with CFSE and restimulation with αCD3/CD28 beads. b Representative flow plots of Annexin V staining and CFSE dilution (CD3+CD8+gated cells) at day 3 after re-stimulation (beads to cell ratio indicated). Percentages of Annexin V+CFSElowCD8+ T cells (n = 5–7). c Percentages of CD8+ T cells positive for CD69, CD25, and CD107a at 4 h of post restimulation (beads to cell ratio = 1:2). Each symbol represents one donor (n = 9). a–c Two-tailed Wilcoxon matched-pairs signed rank test; only significant differences are indicated; HC healthy controls. Source data for this figure are provided as a Source Data file.

