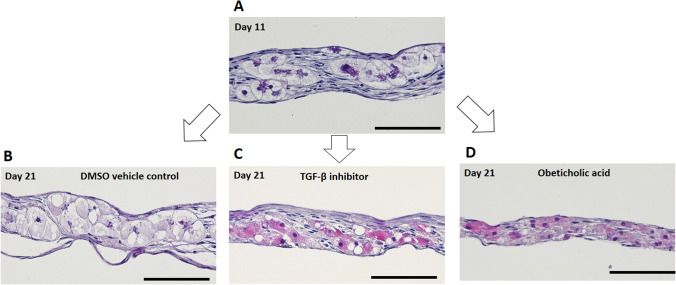
Fig. 4.
Histological changes of iBHs in PHH/NHDF cell sheets after administration of 10 μM TGF-β inhibitor (SB505124) or 10 μM obeticholic acid for 10 days. Representative HE staining images of A PHH/NHDF cell sheets on day 11, B DMSO vehicle control on day 21, C TGF-b inhibitor treated on day 21, and D obeticholic acid treated on day 21 were shown. Scale bar represents 100 μm

