Fig. 2.
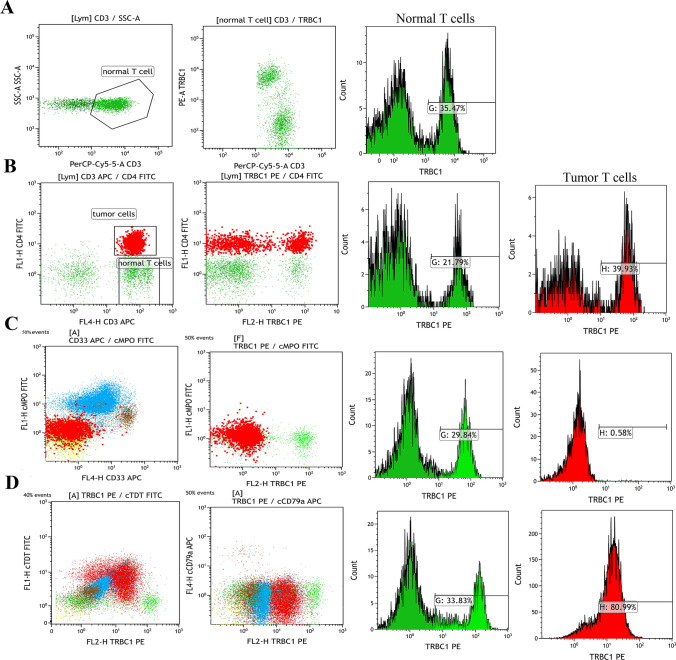
The expression patterns of TRBC1 on tumor cells and normal T cells. a Representative flow cytometry plots from 25 healthy donor bone marrow samples showed expression patterns of TRBC1 on normal CD3-positive T cell populations. b Gates were set in selecting an unclassified CD4+ T-NHL patient with partially positive TRBC1, and dot plots of subclass CD4-FITC/TRBC1 PE with quadrant markers were created. The histogram shows CD4+ T-NHL tumor cells positive for TRBC1 in the R7 gates and CD3+CD4− normal T cells positive for TRBC1 in the R3 gates. c Bone marrow involvement by a representative Pre-T-ALL patient with non-TRBC1-expressing T cell malignancy, showing an expanded cytoplasmic MPO (cMPO)-negative T cell population with an aberrant negative expression of TRBC1. Gated neoplastic cells that are TRBC1 expression-negative (monotypic) are red, and the normal T cells with partial expression of TRBC1 are green. d Bone marrow sample involvement by a representative cortical T-ALL patient with a positive-TRBC1-expressing T cell malignancy (red), showing an expanded cTDT-positive T cell population with aberrant positive expression of TRBC1; green is normal and is negatively expressed, red is abnormal and positively expressed

