Figure 3.
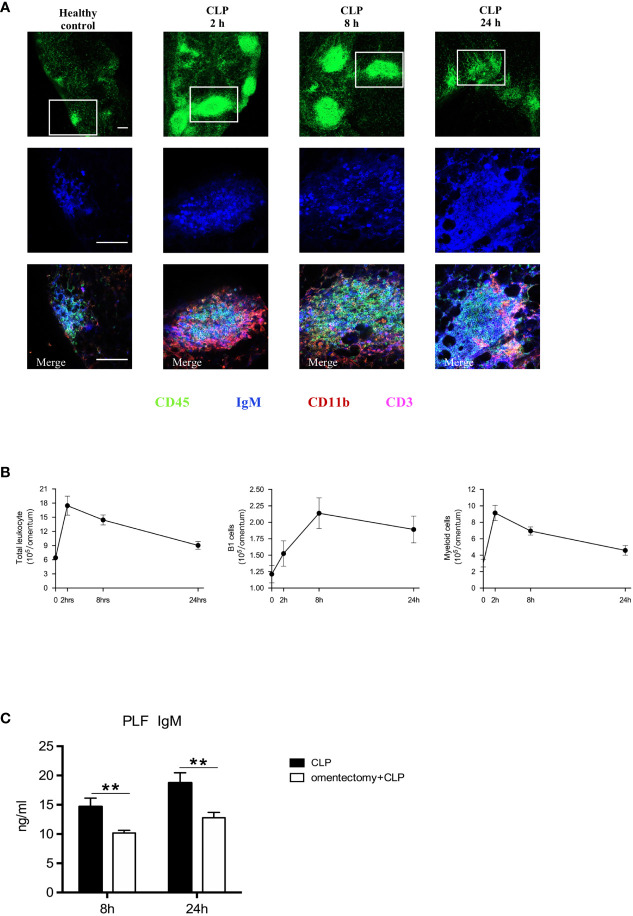
Omental MSs and B cells are elicited in response to peritoneal infections. (A) Whole-mount immunofluorescence staining of the omentum allowing visualization of MSs with CD45+ staining (green)on the top row, B1 cells with IgM+ staining (blue) on the middle row and myeloid cells with CD11b+ staining (red), B1 cells with IgM+ staining (blue), and T cells with CD3+ staining(pink) on the bottom row respectively at indicated time intervals after CLP. Pictures are representative of 6 mice for each condition. The scale bar is 200 μm. (B) At the indicated intervals after CLP, flow cytometric analysis of digested omental cells from healthy controls or CLP mice (n = 6 per group) at indicated time intervals were performed and the numbers of total leukocytes, B1 cells, Myeloid cells were counted. All values are shown as means ± SEM. (C) At indicated intervals after CLP, PLF samples were collected and IgM concentrations were determined by ELISA. All values are shown as means ± SEM. **p < 0.01 for omentectomized vs WT.

