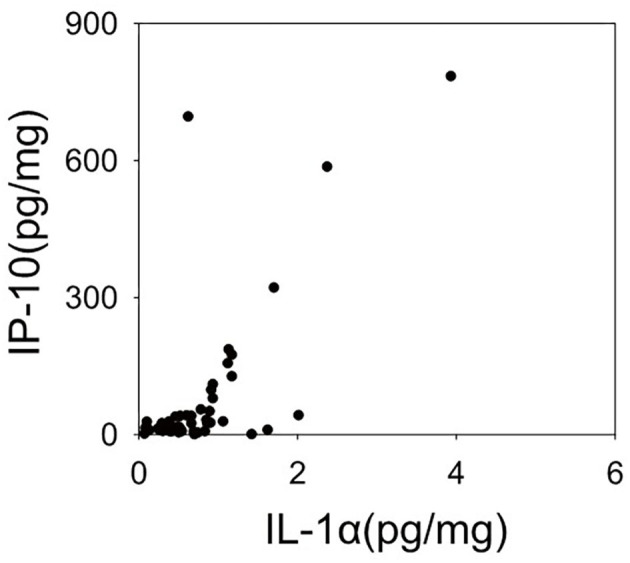
Figure 3.

Scatter plot representing expression levels of Interleukin (IL-1α), Interferon-gamma-inducible protein 10 (IP-10). The expression levels of the two cytokines have a linear relationship. This relationship shows a significant positive correlation in a Spearman's correlation analysis (r = 0.583, p < 0.001).
