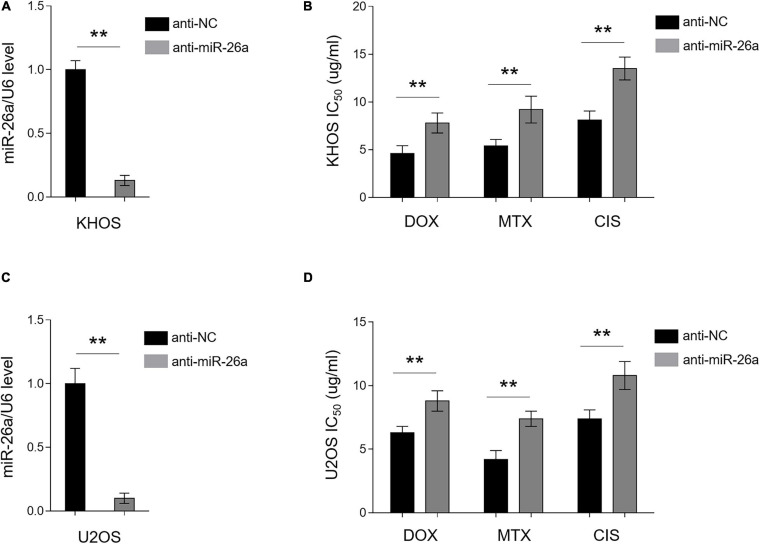
FIGURE 3.
miR-26a knockdown confers multidrug resistance in chemosensitive osteosarcoma cells. (A,B) KHOS cells were transfected with anti-miR-26a or anti-NC for 48 h. (A) miR-26a expression was determined by qRT-PCR analysis. The expression of U6 was used as an internal control. Each column represents the mean value from five replicates. The results are expressed as relative to the control group. Data were analyzed using Student’s t-test. **P < 0.01. (B) Cells were then treated with doxorubicin, methotrexate, or cisplatin for another 48 h. The 50% cytotoxic concentration (IC50) was evaluated by MTT assay. Each column represents the mean value from five replicates. Data were analyzed using Student’s t-test. **P < 0.01. (C,D) U2OS cells were treated as in (A). miR-26a expression (C) and IC50 value (D) were evaluated and presented as in (A,B).

