FIGURE 6.
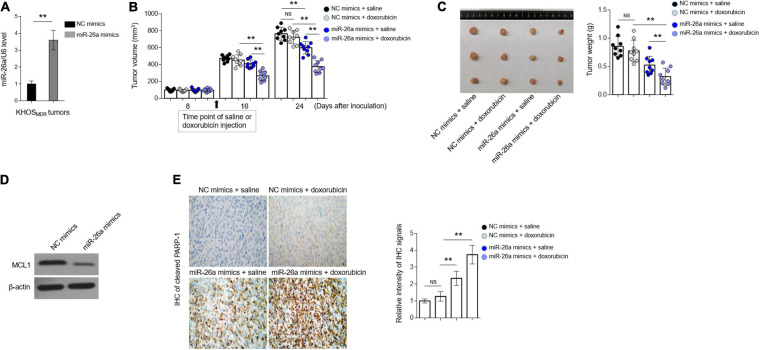
miR-26a reverses doxorubicin resistance in osteosarcoma multidrug resistance (MDR) cells in vivo. (A) MDR KHOS cells were transfected with miR-26a mimic or mimic control for 48 h in vitro and then xenografted into nude mice (n = 9). The mice were intraperitoneally injected with chemotherapeutic drugs every 2 days for 3 weeks. miR-26a expression in tumors was determined by qRT-PCR analysis. The expression of U6 was used as an internal control. Each column represents the mean value from five replicates. The results are expressed as relative to the control group. Data were analyzed using Student’s t-test. **P < 0.01. (B) The tumor volume of MDR KHOS cells treated with doxorubicin was calculated and monitored at 8, 16, and 24 days following injection. (C) The representative images of resected tumor (left half) and tumor weight (right half) are shown. Each symbol represents the value of each tumor. (D) The protein expression of MCL1 in the resected tumors was determined by Western blotting analysis. The representative images are shown. (E) The expression of cleaved PARP-1 was detected in the slices of isolated tumors by immunohistochemistry (IHC) analysis. The intensity of the IHC signals is shown on the right. Data are mean ± SD. Data were analyzed using one-way ANOVA. **P < 0.01. NS, not significant.

