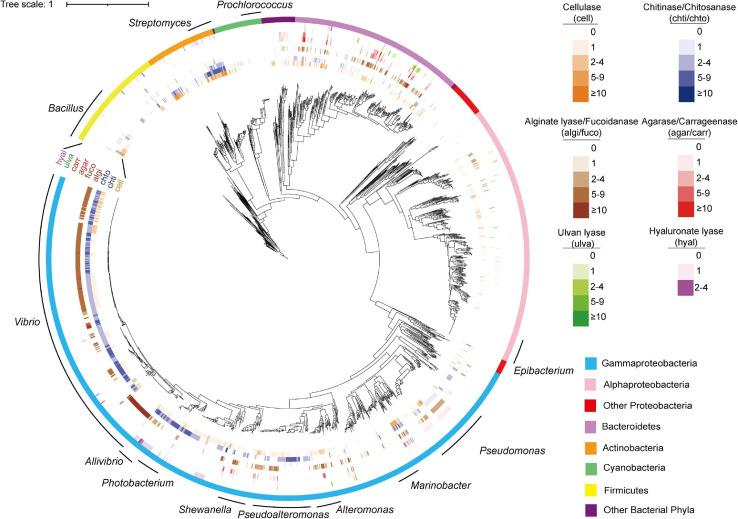
FIGURE 3.
Phylogenetic distribution of PDEs among marine bacterial genomes. The tree was reconstructed based on 31 core genes using IQ-TREE. The figure was prepared with the help of the iTOL server. Enzymes were shown in outer circles as heatmap based on annotated gene number in each genome. The 12 genera subject to distribution analyses at the genus level were indicated with curves.

