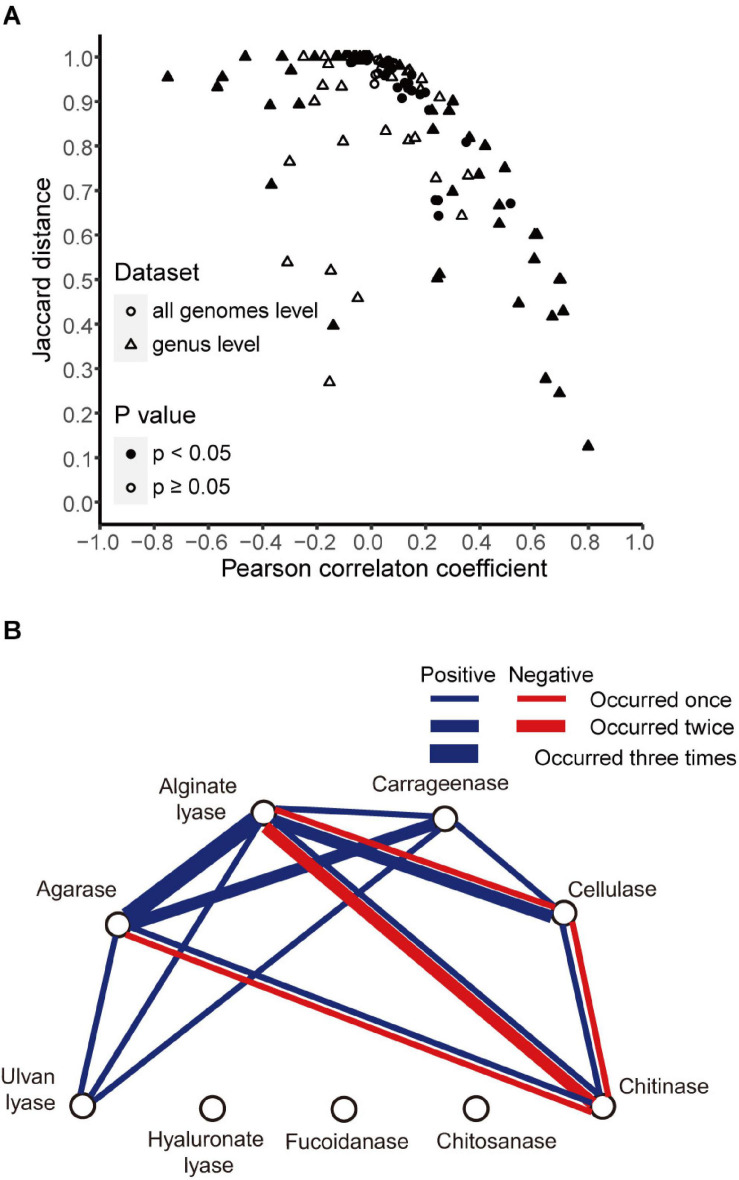
FIGURE 5.
Correlations between enzyme pairs. (A) Pearson correlation coefficients and Jaccard distances between enzyme pairs in all genomes (circle) and in 12 genera (triangle). Symbols were filled when p-value <0.05 for the Pearson correlation coefficients and open otherwise. (B) Correlations between different enzymes found in 12 genera. Blue line, positive correlation; red line, negative correlation. The number of occurrences was indicated with line width (thin, 1; middle, 2; bold, 3).

