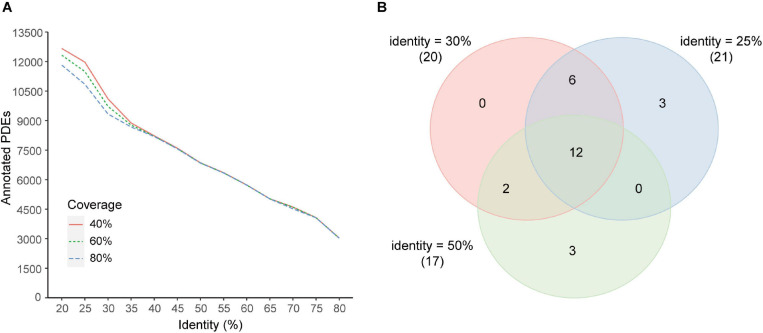
FIGURE 6.
Effects of coverage and identity threshold choice on the results. (A) Number of predicted PDEs under different thresholds. (B) Venn diagram of correlated enzyme pairs predicted with different thresholds (main set, identity 30%; additional set 1, identity 25%; additional set 2, identity 50%; coverage 80% for all sets). Enzyme pairs with the Pearson correlation coefficient |r| > 0.4 and p < 0.05 were regarded as correlated. The number of correlated enzyme pairs for each data set was indicated in parentheses beside the set identity.

